

Manufactured
Capital

Intellectual
Capital
Key enablers
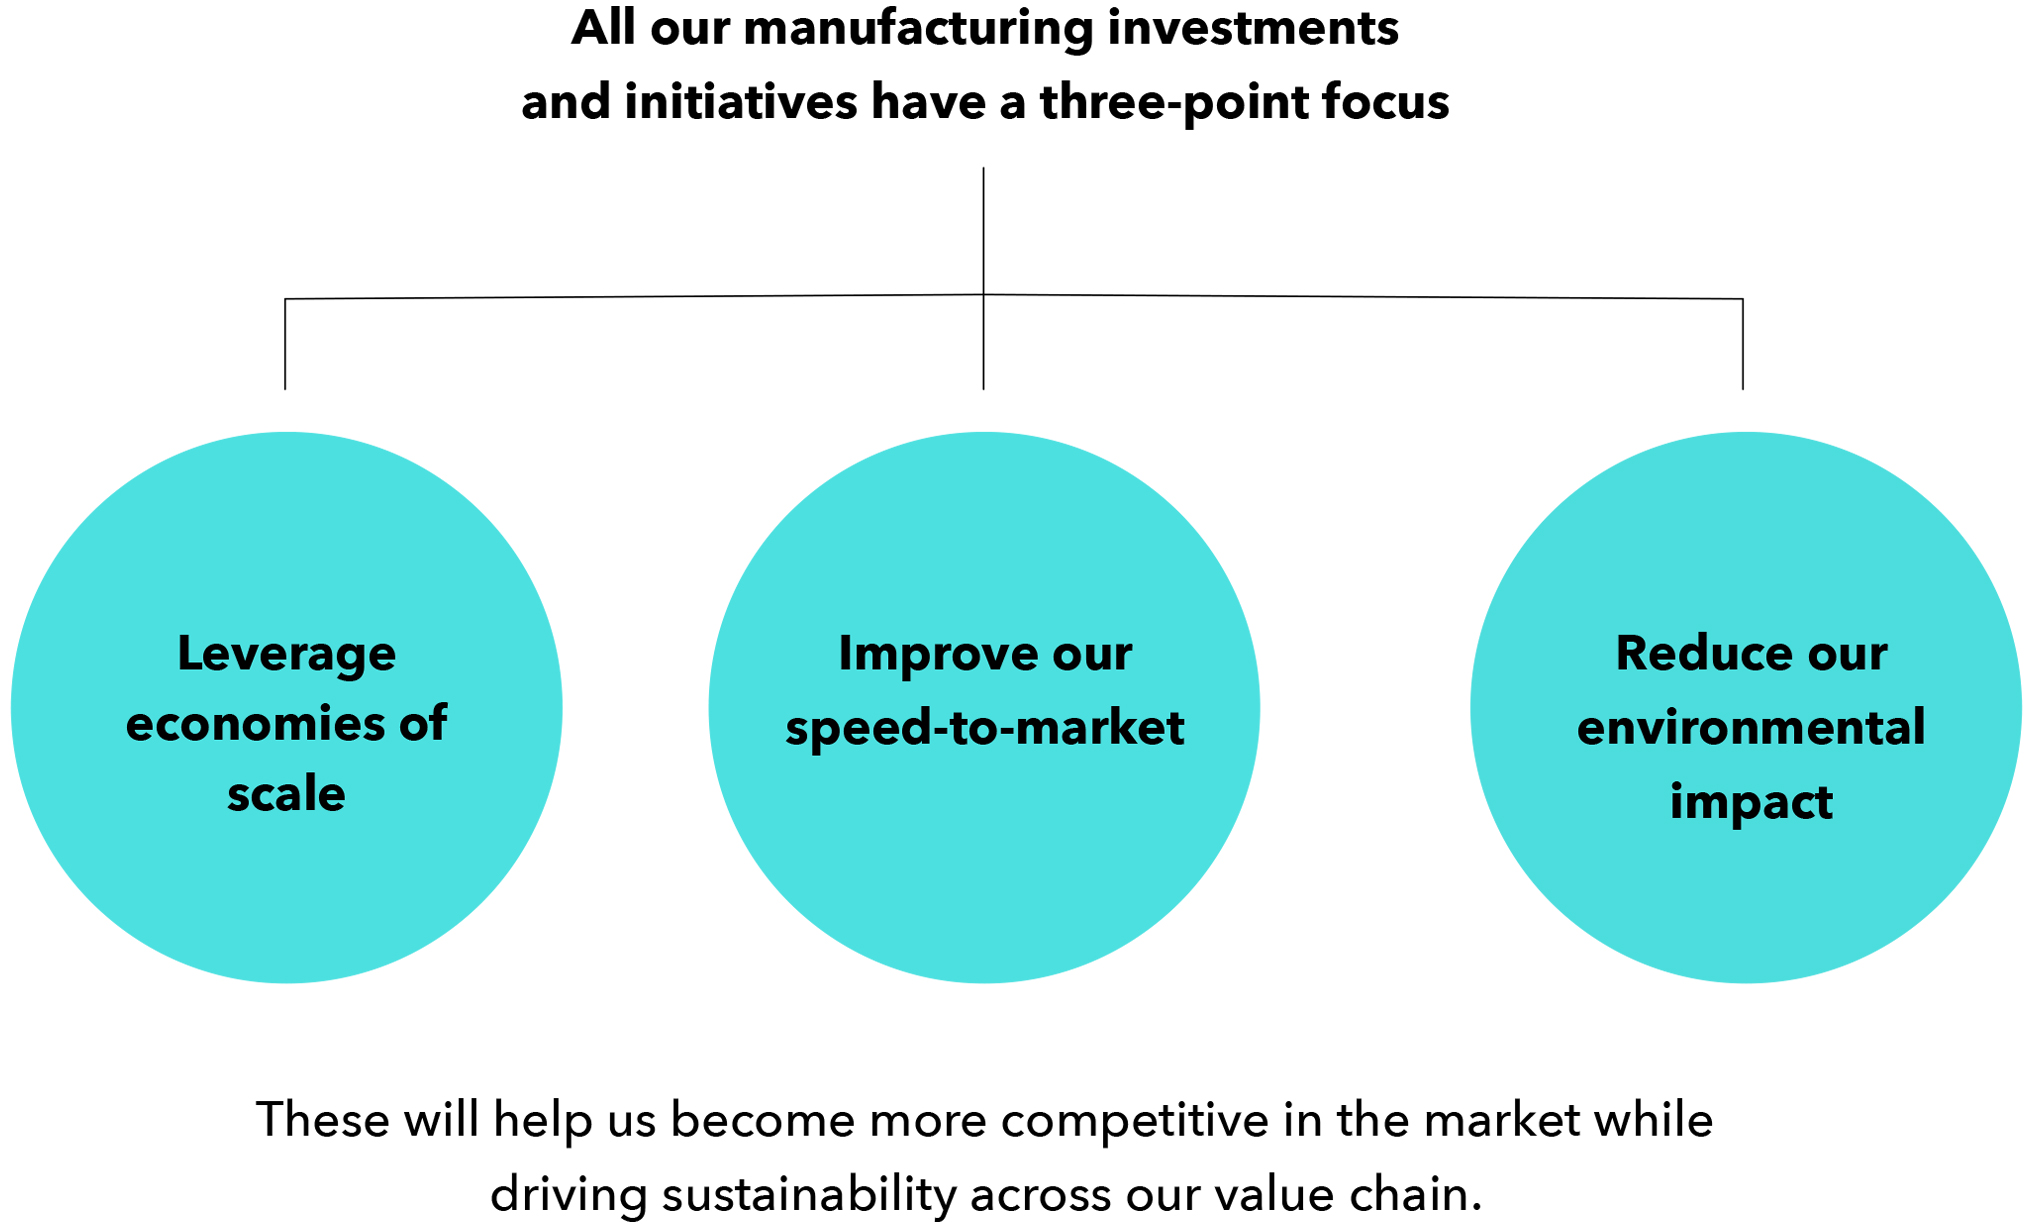
- Leverage
economies of scale - Improve our
speed-to-market
- Reduce our environmental impact
Risks identified
- Changing consumer
preferences - Hyperinflation and
currency devaluation
- Commodity price volatility
- Regulatory
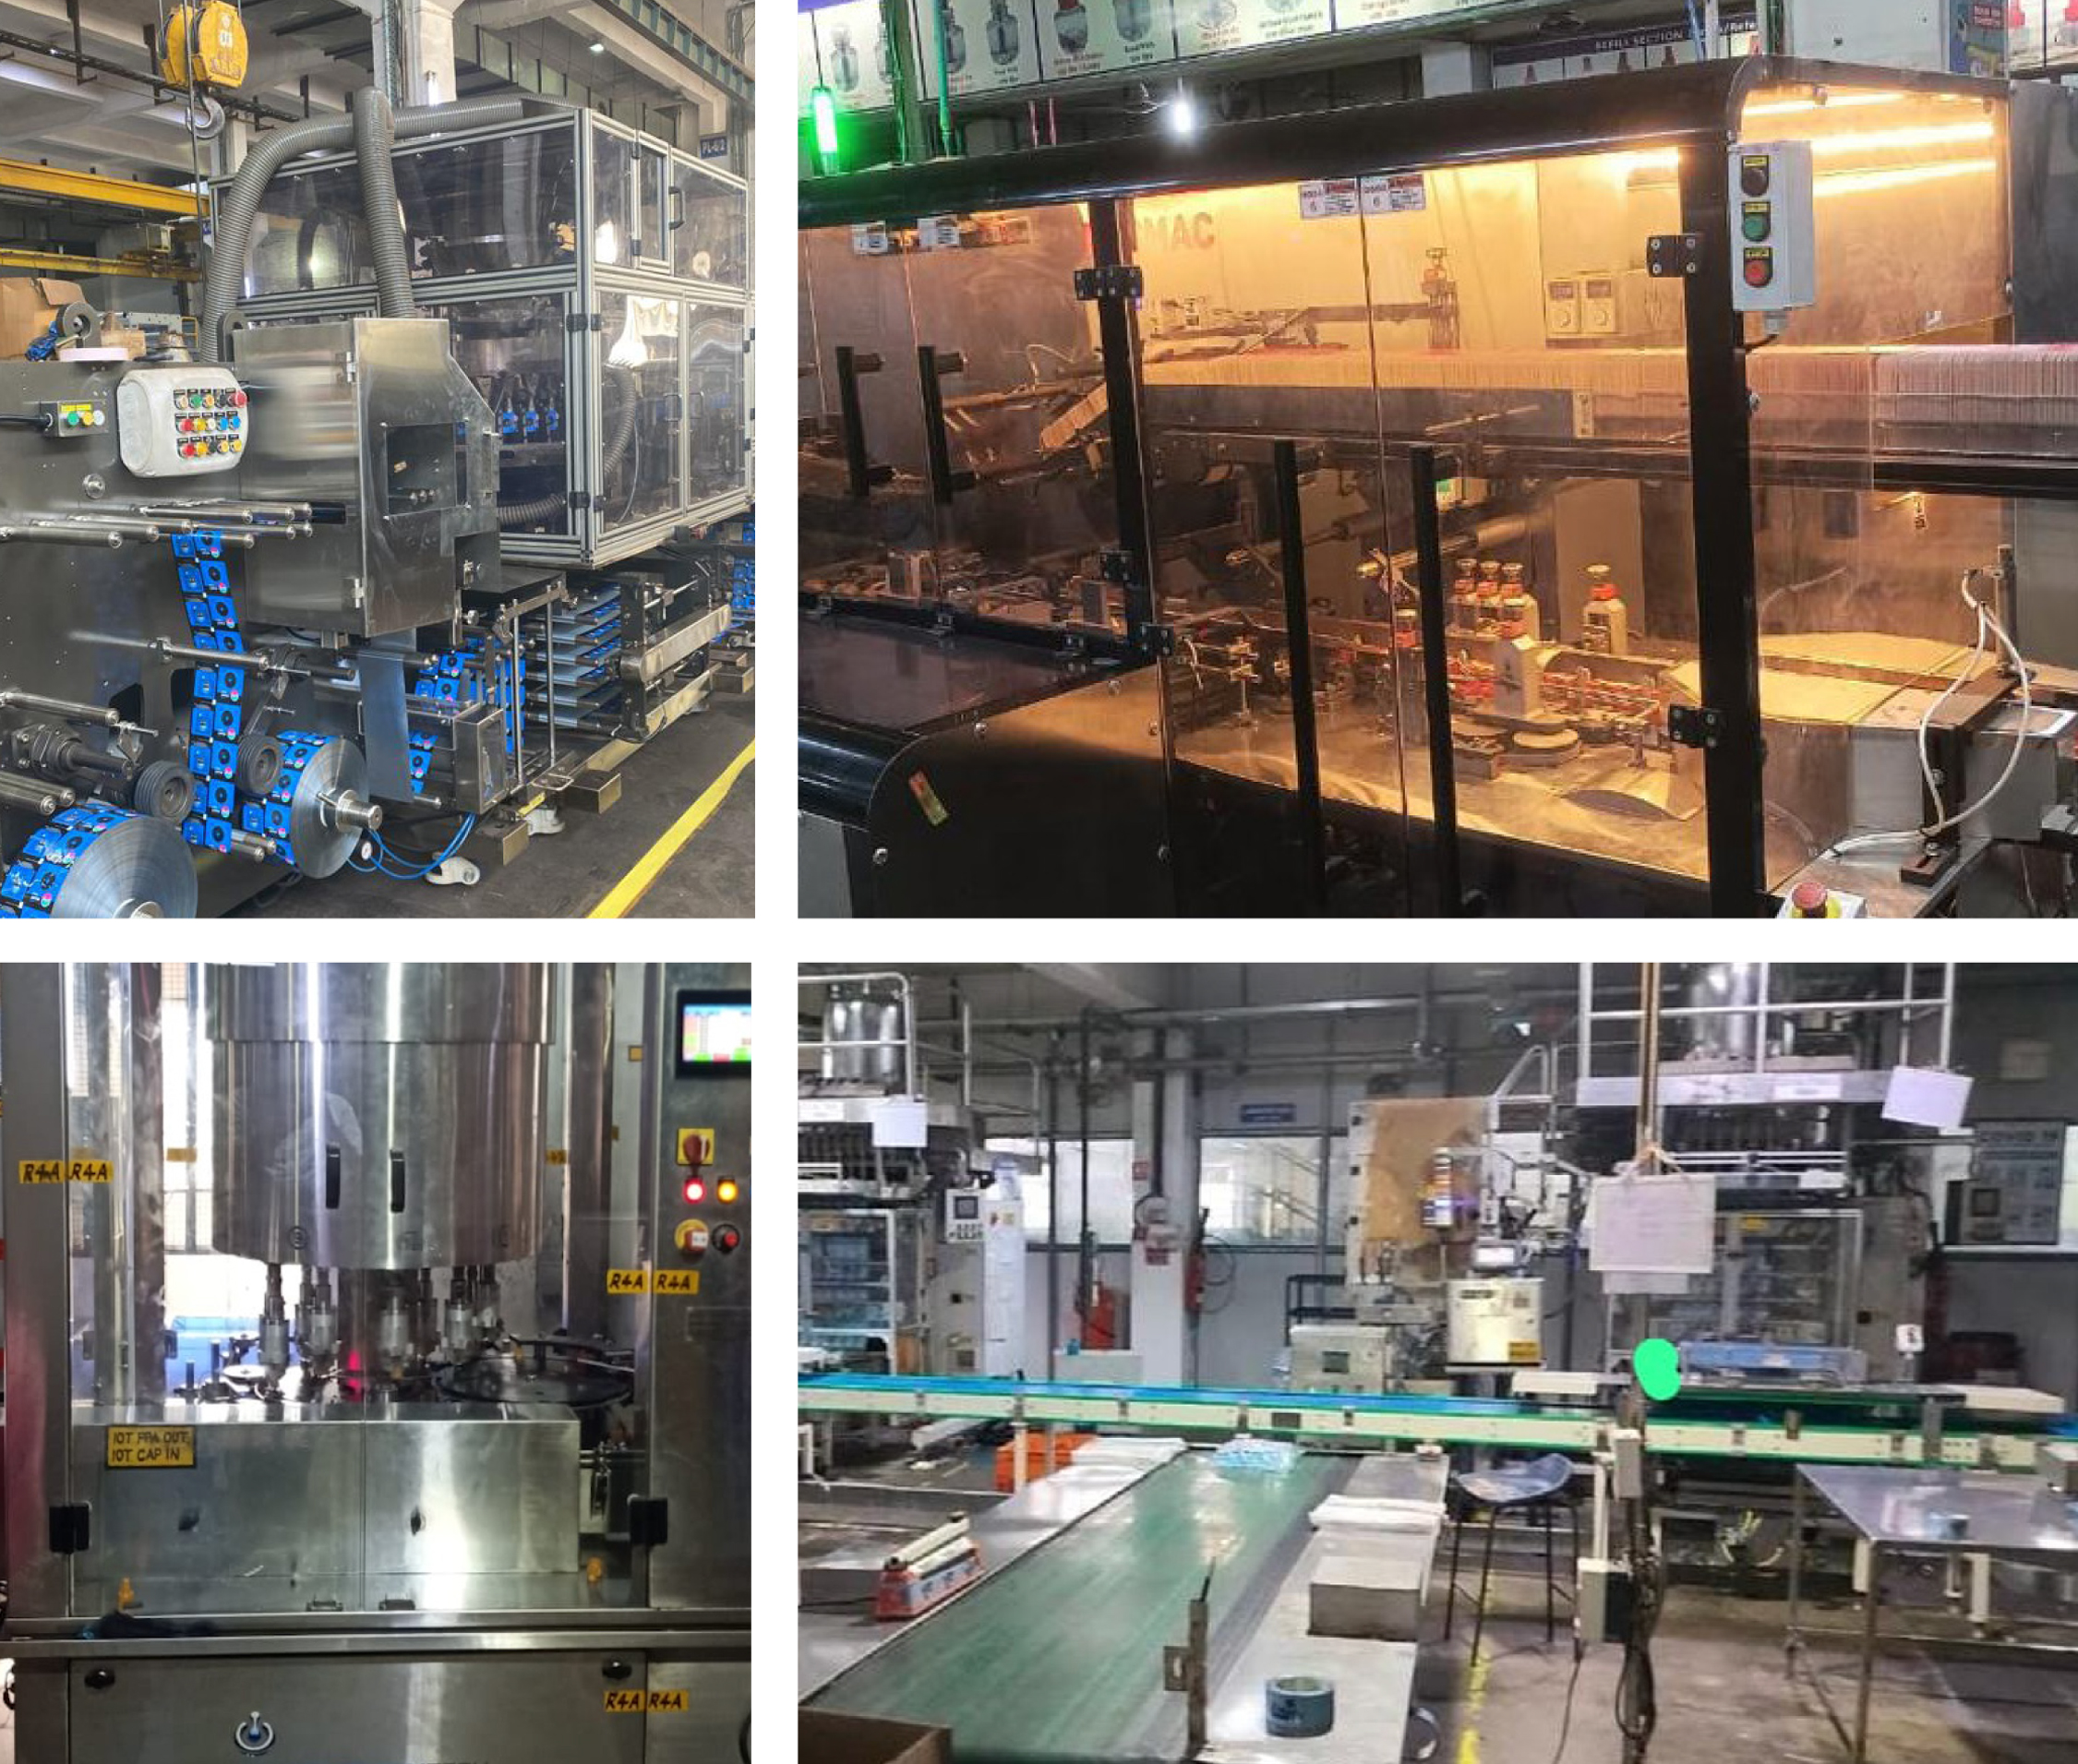
We are simplifying our products and relooking at our innovation processes to focus on what truly matters. We are leveraging our manufactured capital to focus on high-margin products and inventory optimisation, and improving our process efficiency with sustainable manufacturing, industry 4.0, and quality management.

17%
Reduction in
India SKUs
Zero
Waste to landfill
since 2019
48%
Reduction in the
GHG emission
intensity since 2011
Plastic
neutral
In India
Net
zero
By 2035
Simplifying products and
improving process efficiencies
Innovation has always been at the heart of everything we do. We have redefined our approach towards product innovation and renovation to focus on high-impact opportunities that deliver substantial value to our stakeholders in the long term.
Our refined innovation framework emphasises the launch of fewer, yet more significant NPDs that have the potential to drive exceptional growth.
We drive our innovation capabilities to the next level by adopting the following key principles:
- A ‘less is more’ approach: Fewer, bigger, better innovations
- Even more consumer-centric: Deeper insights, prioritising the voice of our consumers in decision-making
- 100% objectivity: Rigorous stage-gate process, right governance
- Become truly global: Efficiently delivering synergies
- Sustainability: Sustainability built into our products from Day 1
While new brand development will continue to be a crucial capability and driver of value, we aim to discontinue smaller brands, where it makes sense from a better parentage/value realisation perspective.
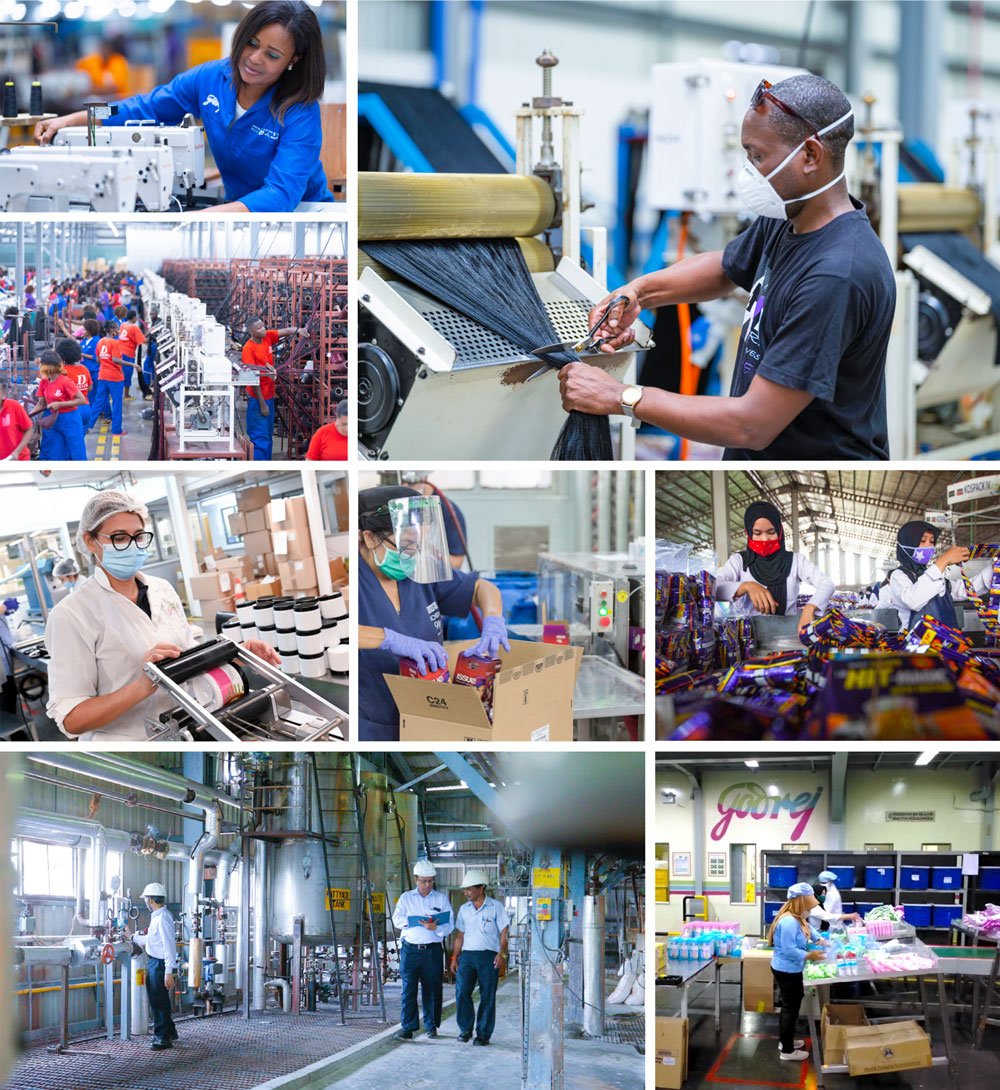
Factories across our locations in India, Africa,
Latin America, and Indonesia
Critical enablers
1. SKU rationalisation
As part of our ongoing commitment to optimising resources and enhancing efficiency, we recently undertook a comprehensive SKU rationalisation exercise across all product portfolios. By streamlining our offerings and focusing on high-performing products, we have achieved significant improvements in manufacturing efficiency and waste reduction.
In India, we successfully rationalised our SKUs by 17% from the fiscal year 2022-23. Similarly, across our Africa, USA, and Middle East cluster, we rationalised our SKUs by 25% in the fiscal year 2022-23. This strategic initiative has enabled us to run a lean supply chain operation, resulting in better resource utilisation for higher value generation while minimising wastages.
In Indonesia, we have reduced our SKU production by more than 50% compared with January 2022. This consolidation has resulted in several benefits:
- Reduced sourcing of packing materials by 50%, resulting in less operational complexity and fewer manufacturing challenges
- Focused replenishments to our distributors, simplifying work processes at our customers’ end by managing a smaller number of SKUs
- Reduced obsolete stock provisions by 10%, as we concentrate on running profitable SKUs and eliminating tail SKUs
Strengthening business outcomes
SKU rationalisation in Kenya
In 2021, our Kenyan operations produced approximately 3,000 SKUs spanning our Hair and Personal Care categories. Recognising the potential for improvement, we conducted an in-depth analysis of these SKUs and successfully reduced them by 80% over the subsequent years, arriving at just over 570 SKUs.
This strategic consolidation has yielded several noteworthy benefits, including reduction in inventory storage requirements and minimisation of wastage. The adage ‘less is more’ proved apt in this context, as our streamlined product offerings have allowed us to direct our resources and growth initiatives more effectively.
Moving forward, we will continue to assess and refine our SKU offerings to further drive focused growth and operational efficiency across all our global markets.
2. Inventory optimisation
In our continuous pursuit of operational excellence, we have achieved a noteworthy milestone of reducing our inventory days. This strategic enhancement in working capital management enables us to better adapt to fluctuating market conditions and align our supply chain more effectively with consumer demand. To achieve this, we have implemented several digitisation initiatives across our manufacturing and supply chain operations. Among these initiatives is the adoption of a Transportation Management System, which has helped us better manage our transportation operations, optimise routes and loads, and lower freight costs.
Additionally, we have automated the scheduling and planning processes, integrating our supply chain to allow real-time decision-making to improve the overall efficiency. We have made significant progress in key projects, including the development of a future network footprint for our distribution network and implementation of replenishment-driven sales strategies for our distributors.
In parallel, we are continuously refining our demand-forecasting capabilities by leveraging advanced analytics and historical sales data.
This approach allows us to predict future demand with greater precision and proactively adjust inventory levels, thus minimising the risk of stock-outs and excess inventory while ensuring the timely availability of our products to consumers.
Our commitment to inventory optimisation remains steadfast as we continue to explore and implement innovative solutions to drive efficiency, reduce costs, and enhance customer satisfaction across our global operations.
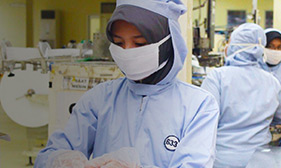
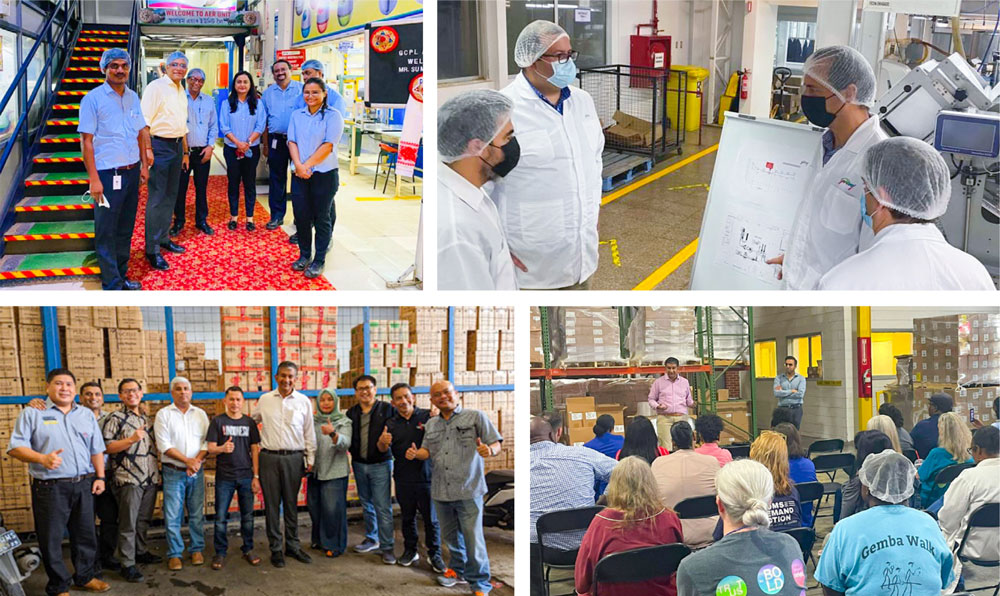
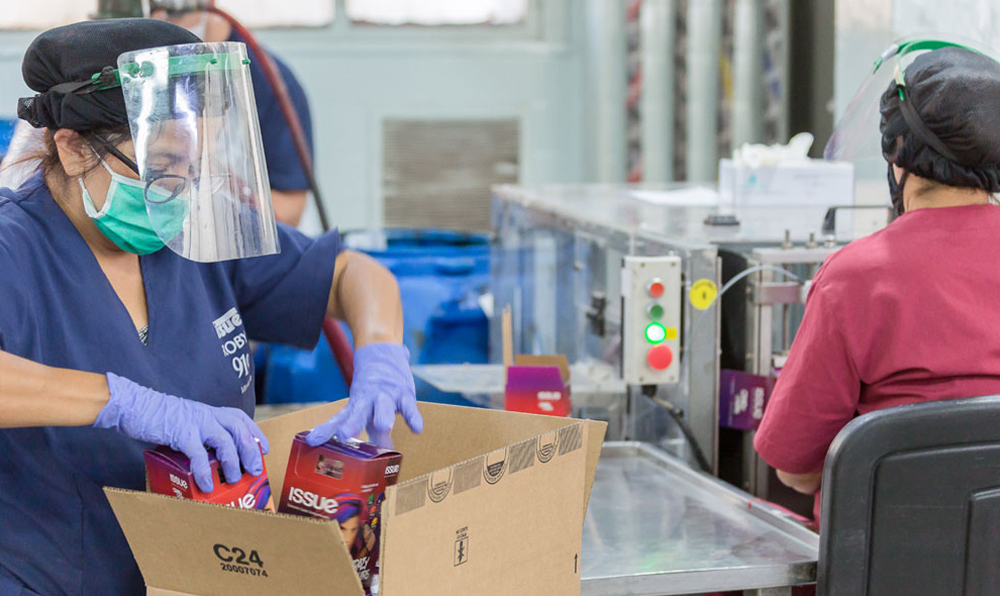
Engaging with shopfloor employees
3. Industry 4.0
We are investing in advanced automation technologies and IT systems to enhance our manufacturing processes, minimise manual intervention, and boost operational efficiency.
In our North Cluster, we implemented a cloud-based computerised maintenance management system software at our Katha plant to strengthen onsite maintenance practices. This system effectively manages maintenance and preventive maintenance activities by creating schedules, maintenance requests, and job plans. Consequently, we have optimised spare inventory and reduced maintenance costs.
Our Industry 4.0 digitisation initiatives have not only increased productivity but also reduced energy costs. These initiatives align with our environmental objectives while promoting longer equipment life.
To effectively monitor energy and utility consumption, we installed an energy and utility management (EMS) system at our Katha and Kathua plants. Daily tracking and analysis of plant energy data allow us to take timely corrective actions to reduce energy consumption, improve equipment health, and establish comparative analysis for various product SKUs.
Following the implementation of EMS, specific energy consumption has reduced by 5%. Moreover, the system has empowered our shop floor workers with reliable, on-demand access to data through hand-held devices, replacing manual methods.
We have successfully integrated IoT across all five soap lines in our North Cluster. IoT implementation in our production lines has enabled real-time data analysis and facilitated timely decision-making to improve equipment productivity, reduce manual intervention, minimise breakdowns, and enhance operational efficiency by identifying bottlenecks.
IoT implementation at our Katha soap plant has significantly improved critical decision-making based on data analytics, yielding a 6% increase in the plant’s OEE. Similarly, we have incorporated IoT into both soap lines at our Kathua plant, yielding a 5% increase in plant OEE.
IoT implementation and digitisation initiatives play a crucial role in reducing change and set-up losses for all soap lines, analysing frequent minor stoppages, creating history cards for major equipment breakdowns, and guiding corrective and preventive actions.
In our South Cluster, we installed an online visual inspection system featuring 360-degree cameras in the LV line at our Conso plant in Puducherry. This system detects defects in real time and automatically ejects defective products, reducing the need for manual intervention and thus improving the quality of finished goods. At the same plant, we have implemented an automated finished goods loading conveyor system with automated counting, auto data push to SAP, and sales invoice operations in SAP. This automation tool has streamlined the booking process, reducing both time spent and manpower requirements.
IoT implementation at our
manufacturing facilities
Furthermore, we have installed a SMART coil feeding system in each line of our Coil-6, Coil-7, and Coil-9 units to decrease manpower requirements. We have also incorporated an IoT-based flow-wrapping system with smart feeding in Line-2 of Coil-9 to reduce dependence on manual labour. At our Conso factory, we have installed an IoT-linked servo capper in the refill line, eliminating quality defects caused by broken wicks.
In the North East cluster, we have launched 27 automation projects, including the introduction of flow wrap machines, cartoning machines for LV lines, and filling machines. These initiatives have reduced manpower requirements and significantly improved the OEE of our operations. Specifically, we have seen 13% and 7.6% increases in the OEE of our Godrej Expert Rich Crème and aer lines, respectively.
In the Central West cluster, we have implemented 8 automation projects, including flow wrap machines, soap banding machine, and electric stackers for moving finished goods.
These initiatives have led to a reduction in manpower requirements and significant cost savings.
4. Sustainable manufacturing
By optimising our manufacturing processes, reducing waste, and implementing energy-efficient technologies, we can minimise our environmental footprint and contribute to a more sustainable future. We are driving sustainability initiatives across the supply chain and even extending them to our vendors through our Sustainable Procurement Policy.
As part of our Good & Green vision, we have identified environmental sustainability goals to be achieved by the fiscal year 2025-26. We aim to make one-third of all our products greener than those in 2020. We intend to source at least 35% of our energy mix from renewable sources, improve energy efficiency by 100% in line with our EP100 commitment, and maintain a zero waste to landfill status.
We track energy, emissions, water, and renewable data for all the locations where we have 100% operational control. We are now imbibing carbon and water pricing to capture the financial implications of our emissions and water use and build sustainability into decision-making at every point in the value chain.
To measure our progress against our environmental goals, we use the standards, methodologies, and assumptions entailed in the ‘IPCC Guidelines for National Greenhouse Gas Inventories, 2006’, and the ‘IPCC AR6 Assessment Report’. Our performance is guided by the sustainability team at the corporate level and driven by manufacturing cluster heads and team members at each of our manufacturing locations.
Our processes include:
- Extensive meetings with multiple stakeholders to align on priorities, budgets, and expected benefits for the year
- Setting targets to help drive environmental sustainability in our manufacturing process and brands
- Cascading an annual operating plan where sustainability targets are included in the key responsibility areas for ‘Green Champions’
- Using an internal sustainability monitoring tool to collect and analyse data, and generating monthly reports highlighting key indicators, including the carbon footprint as per the established GHG protocol
- Identifying and circulating best practices on multiple platforms for wider adoption
- Strong governance mechanism to monitor, review, and improve sustainability performance
- Strategic improvement planning for underperforming units
- An innovation cell to look at bleeding-edge sustainability solutions for the medium to long term
- Participating in multiple ESG disclosures to measure our performance against peers engaging external consultants when required for specific initiatives such as materiality or climate risk assessments
Optimising our manufacturing processes towards
contributing to a more sustainable future
Our goals and performance for 2025-26
Energy*

Reduce specific energy consumption by 40% by 2025 (v. 2011 baseline)
Increase renewable energy portfolio to 35% by 2025 (v. 2011 baseline)
Approach
- Improvements in processes and increase in the efficiency of systems
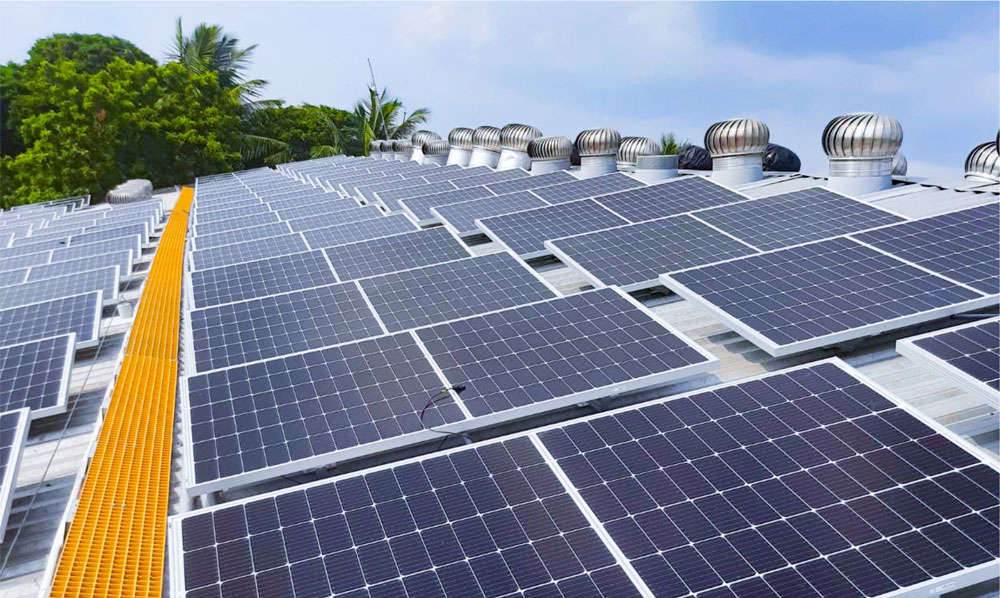
- Adoption of green energy sources such as solar and biomass
- Upgradation of technologies

Reduced our specific energy consumption
by 39%
Increased renewable energy portfolio
to 31.6%
Water**

Reduce water intensity by 40% by 2025 (v. 2011 baseline) while maintaining water positivity
Approach
- Innovative water management systems, technological improvements, and the integrated watershed management programme
Reduced water intensity by 30% and achieved water positivity (through rainwater harvesting within our facilities and our community watershed programme, we are conserving six times more water than we use in our operations).
Emissions***
Reduce GHG emission intensity by 45% by 2025 (v. 2011 baseline)
Approach
- Adopting cleaner fuels such as biomass and continually improving process efficiencies
Reduced our GHG emission intensity by 48%
Waste****
Sustainable packaging commitment
- Maintain zero waste to landfill and achieve zero liquid discharge
- Collect and recycle 100% of pre and post-consumer plastic
- Minimum 50-microns thickness of plastic product labelling to include the thickness of plastic and extended producer responsibility (EPR) registration details
- 20% reduction in packaging intensity
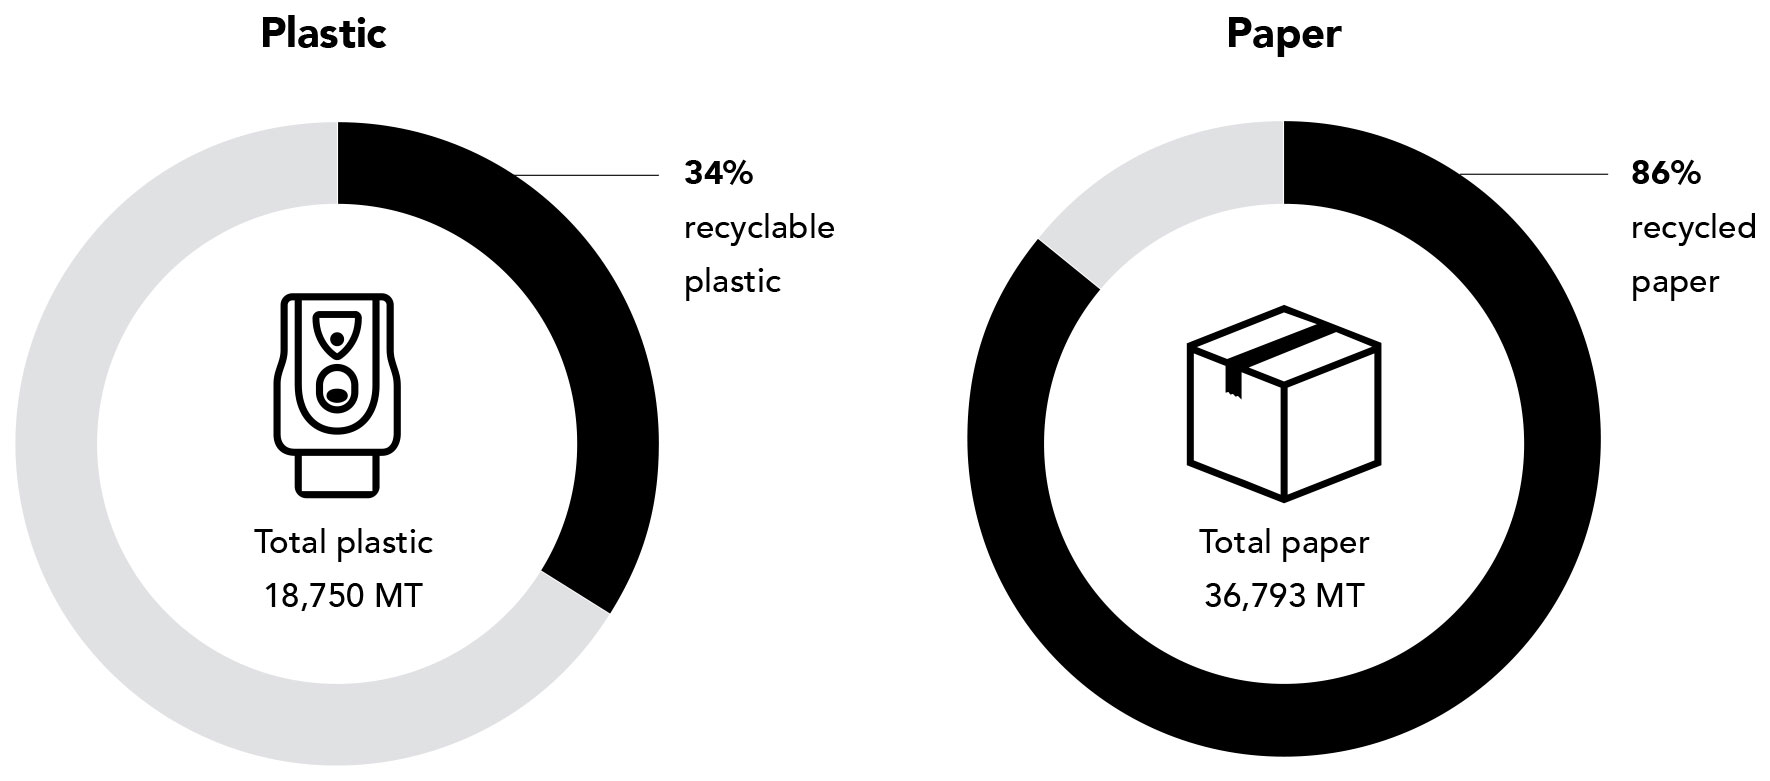
- 80% of plastic used to be recyclable
- Rigid plastics to be replaced by 30% recycled plastic by 2025-26. Flexible plastics to be replaced by 10% recycled plastic by 2026-27 and multi-layer plastics to be replaced by 5% recycled plastic by 2026-27.
Approach
- Judicious and innovative use of materials, including reuse and recycling and greater circularity
- Establishment of a monitoring system to track and implement initiatives to reduce plastic packaging consumption and intensity.
- Exploring vendors and enterprises to increase our use of PCR plastic instead of virgin plastic
Our specific waste to landfill has reduced by 100% (diverted 100% waste from landfill)
We are plastic neutral in India and collect and recycle 100% of pre and post-consumer plastic that we send out
*Energy use is calculated by specific energy consumption per tonne of production
**Water usage is calculated by specific water consumption per tonne of production
***Emissions are tracked for Scope 1 and 2 and calculated by specific GHG emissions per tonne of production
****Waste generated is calculated by specific waste to landfill per tonne of production
1. Energy
This year, our energy performance is on track with our vision 2025. We have implemented over 40 green initiatives across all our locations.
Highlights from the fiscal year 2022-23:
- In the South Cluster, we transited from IE1- to IE4-rated motors in our MM Nagar manufacturing plant. The high-efficiency motors offer benefits such as reduced power consumption, reduced operating temperatures, and decreased thermal stress on motor components. The switch to IE4 motors not only contributes to energy conservation but also extends the motor service life, thereby enhancing our overall operational efficiency. Installing the energy-efficient IE4 motors saves us over 71,600 kWh a year. This is equivalent to emission savings achieved by planting approximately 960 trees annually.
- In the North Cluster, we have installed 624- and 336-kWp capacity solar rooftop power plants in Kathua and Thana plants, respectively, which help us generate over 9 lakh units of clean energy per annum. This has built the renewable energy porfolios of Kathua and Thana plants to 17% and 46%, respectively.
Energy consumption (MWh) - India
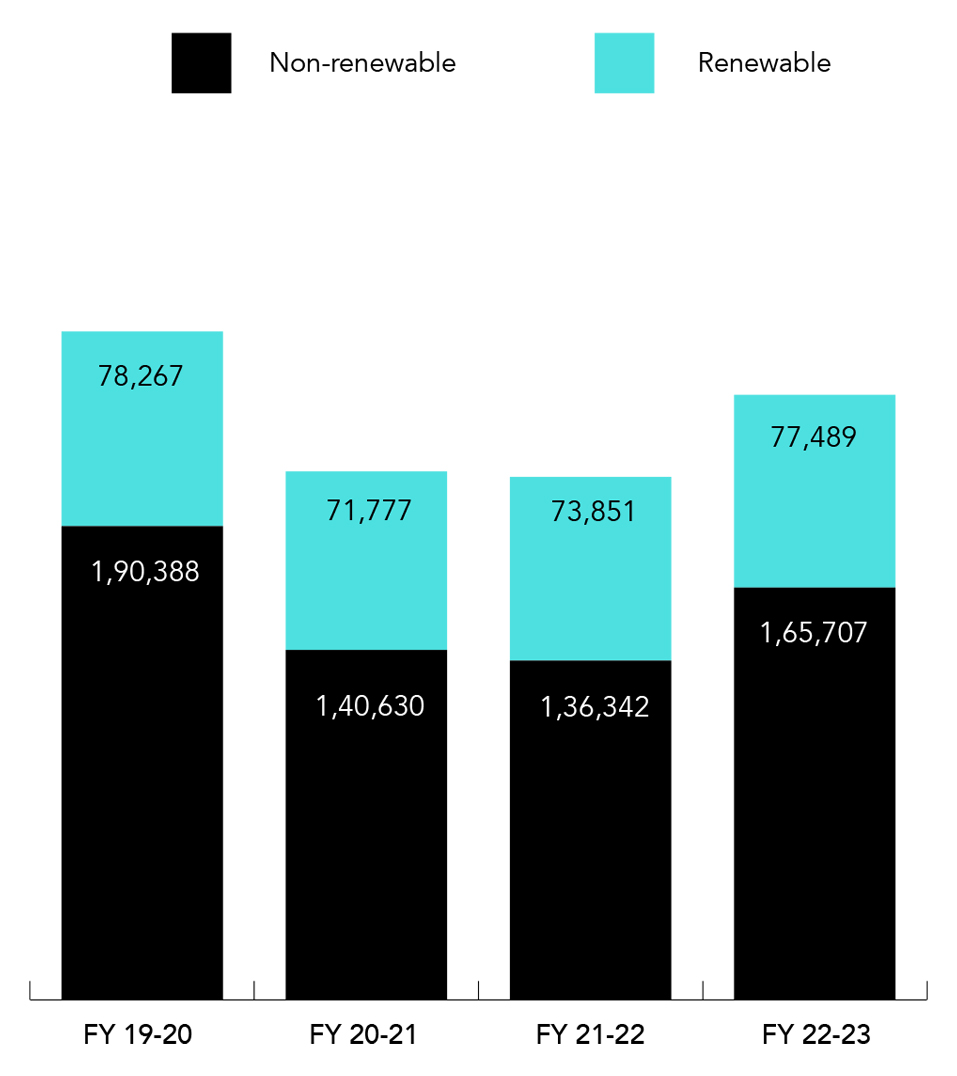
Energy consumption (MWh) - Global FY22-23
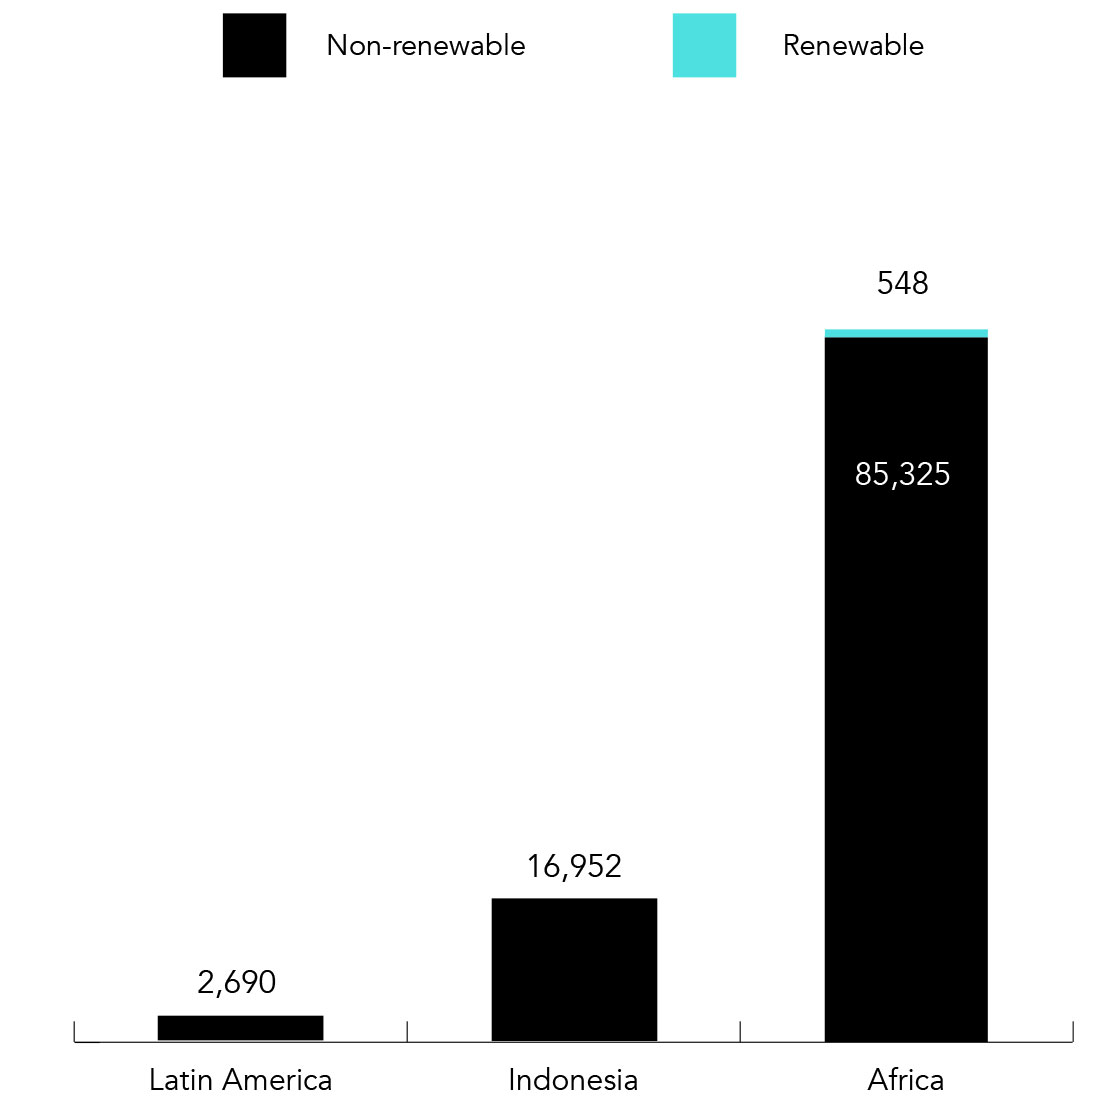
No renewable energy at Indonesia and Latin America
Adopting solar energy to
power our factories
2. Water
We have evaluated and implemented innovative projects to reduce our specific water consumption. Our performance is in line with our set targets. We continue to source our water from sustainable sources and have also supported integrated watershed projects to replenish groundwater levels.
Highlights from the fiscal year 2022-23:
- In India, we have established a zero liquid discharge process at each of our plant locations. In the North Cluster, water processed through the common effluent treatment and the ETP/STP-treated water is recycled and used for domestic purposes in our plants.
- Similarly, in the South Cluster, we generate no process waste water. Our STP treats all waste water and recycles it for domestic use. We ensure no waste is discharged out of our plants.
- In the Central West Cluster, we have installed a rainwater harvesting system in our new soap plant. This has resulted in harvesting of approximately 15 lakh litres of water per annum.
- In Argentina, our team has implemented several measures to reduce water consumption in our processes.
Water consumption (million cubic meters) - India
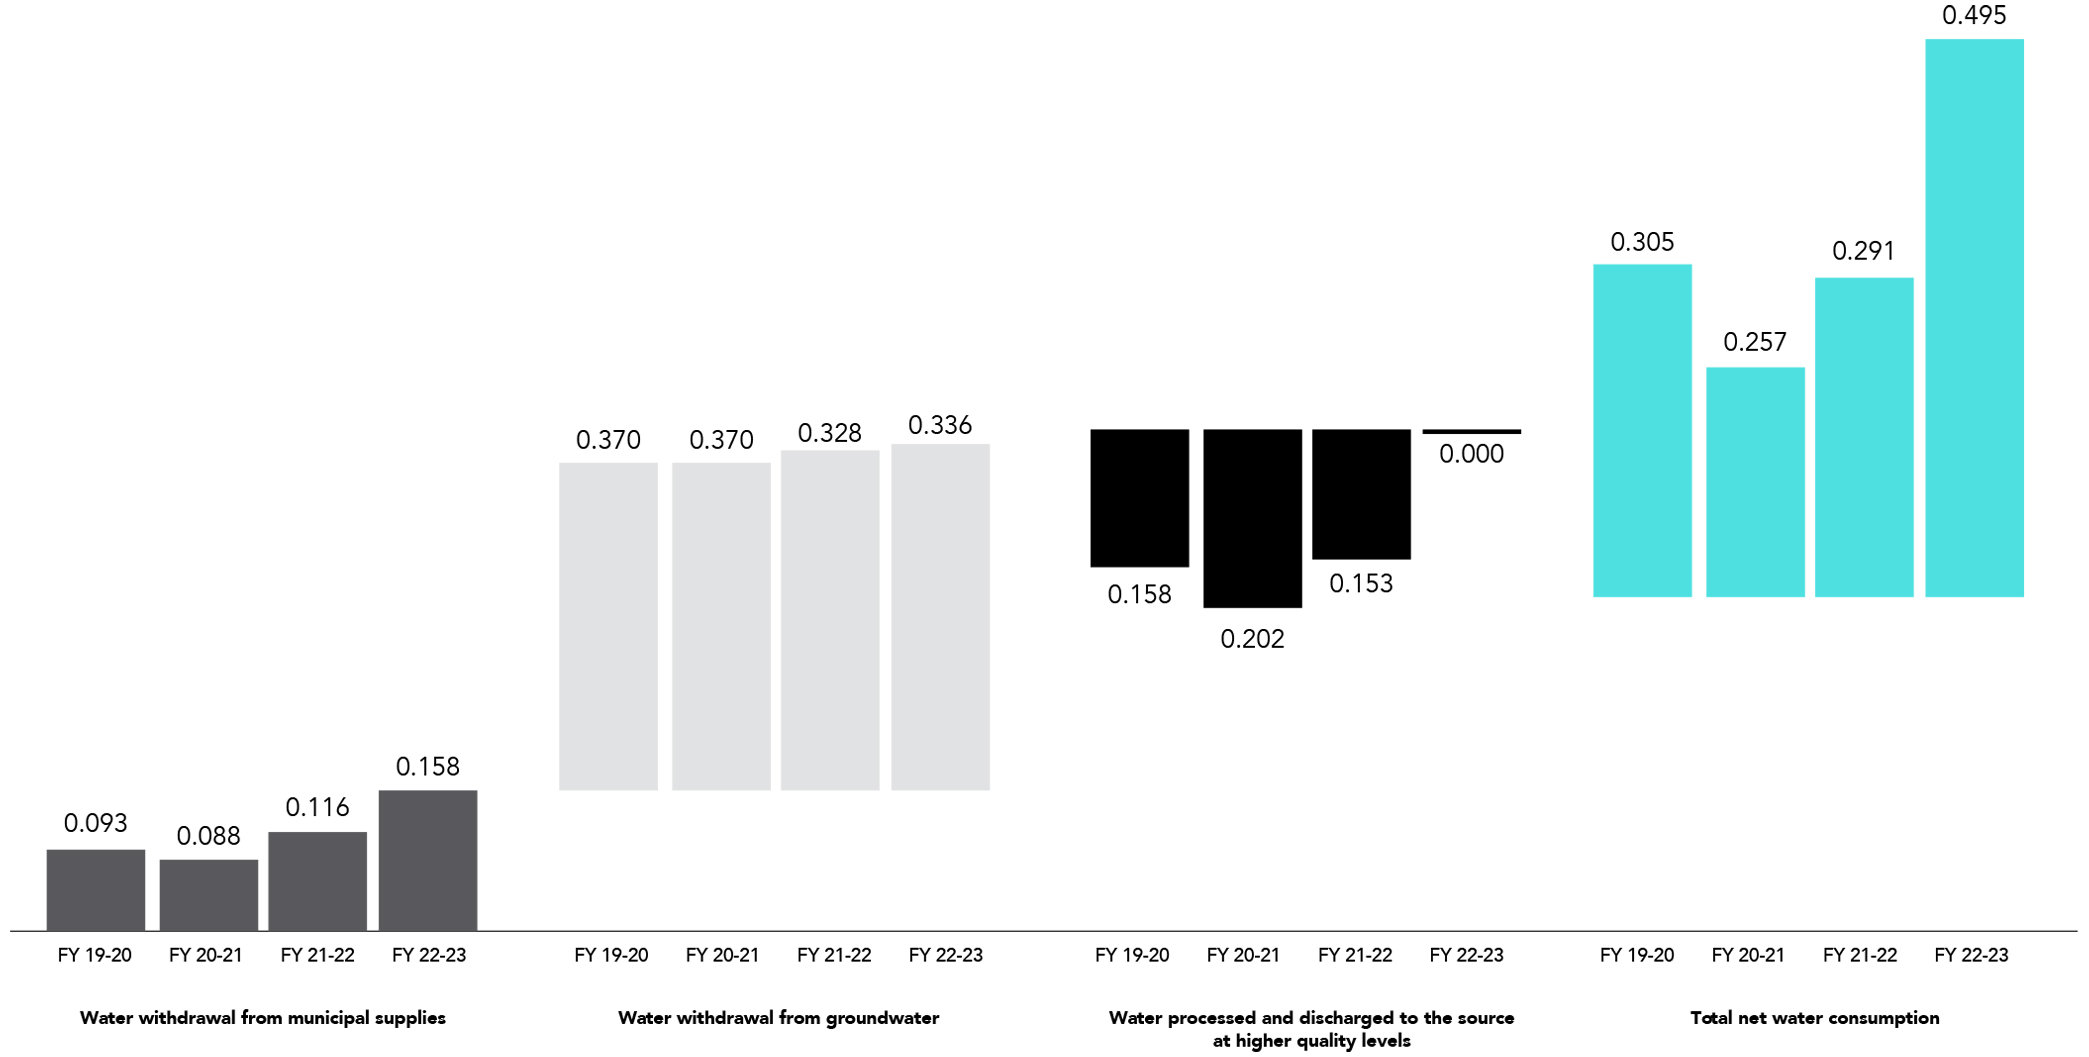
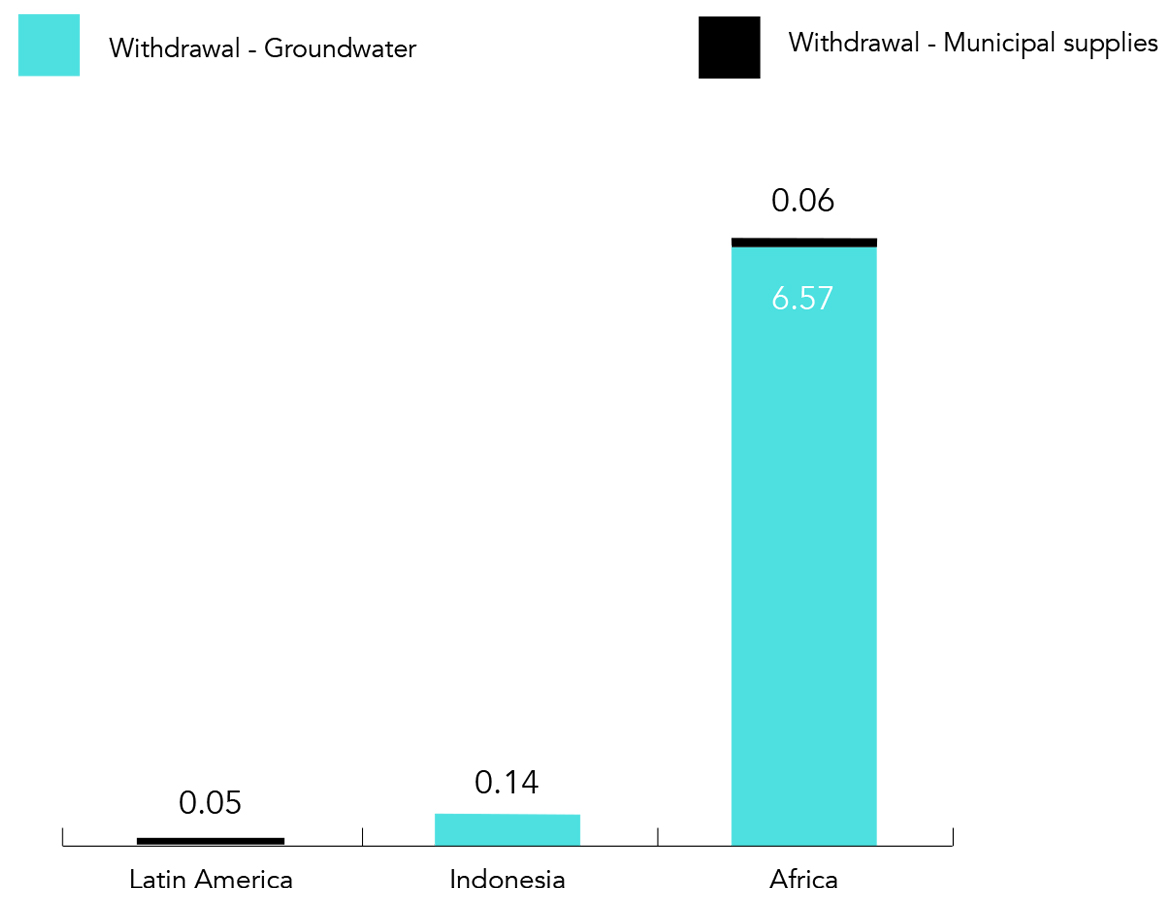
Water consumption (million cubic meters) - Global FY 22-23
3. Emission
All our manufacturing units have implemented systems for monitoring GHG emissions and short-term reduction targets with the long-term aim of achieving Scope 1 and 2 carbon neutrality.
Our initiatives on improving energy mix and reducing specific consumption have helped us reduce our GHG emissions.
Some of these initiatives include switching to renewable biomass for boilers, increased procurement of renewable energy, flue gas heat recovery from boilers for process utilisation, and installation of energy-efficient equipment, among others.
Highlights from the fiscal year 2022-23:
- In the Central West Cluster, we have installed 1,700-kWp shed solar panels. This installation has resulted in the generation of 25 lakh units of power per annum, thereby helping us reduce our GHG emissions.
- In addition to increasing renewable energy consumption, we have implemented a strong energy efficiency programme and set specific energy reduction targets. To double our energy productivity by 2030 as against the 2018 baseline, we are committed to the Climate Group’s EP100 initiative.
- We are committed to reducing our emissions in line with the global Science Based Targets initiative (SBTi) and have set and submitted science-based reduction targets for emissions aligned with the Well Below 2 Degrees Scenario, which are currently being validated by the SBTi committee.
- We have set an internal science-based commitment to be Scope 1 and 2 net zero by 2035. We have already implemented initiatives such as community carbon mitigation programmes to be on track to net zero.
More details on our net zero by 2035 commitments in the pillar ‘People and planet alongside profit’.
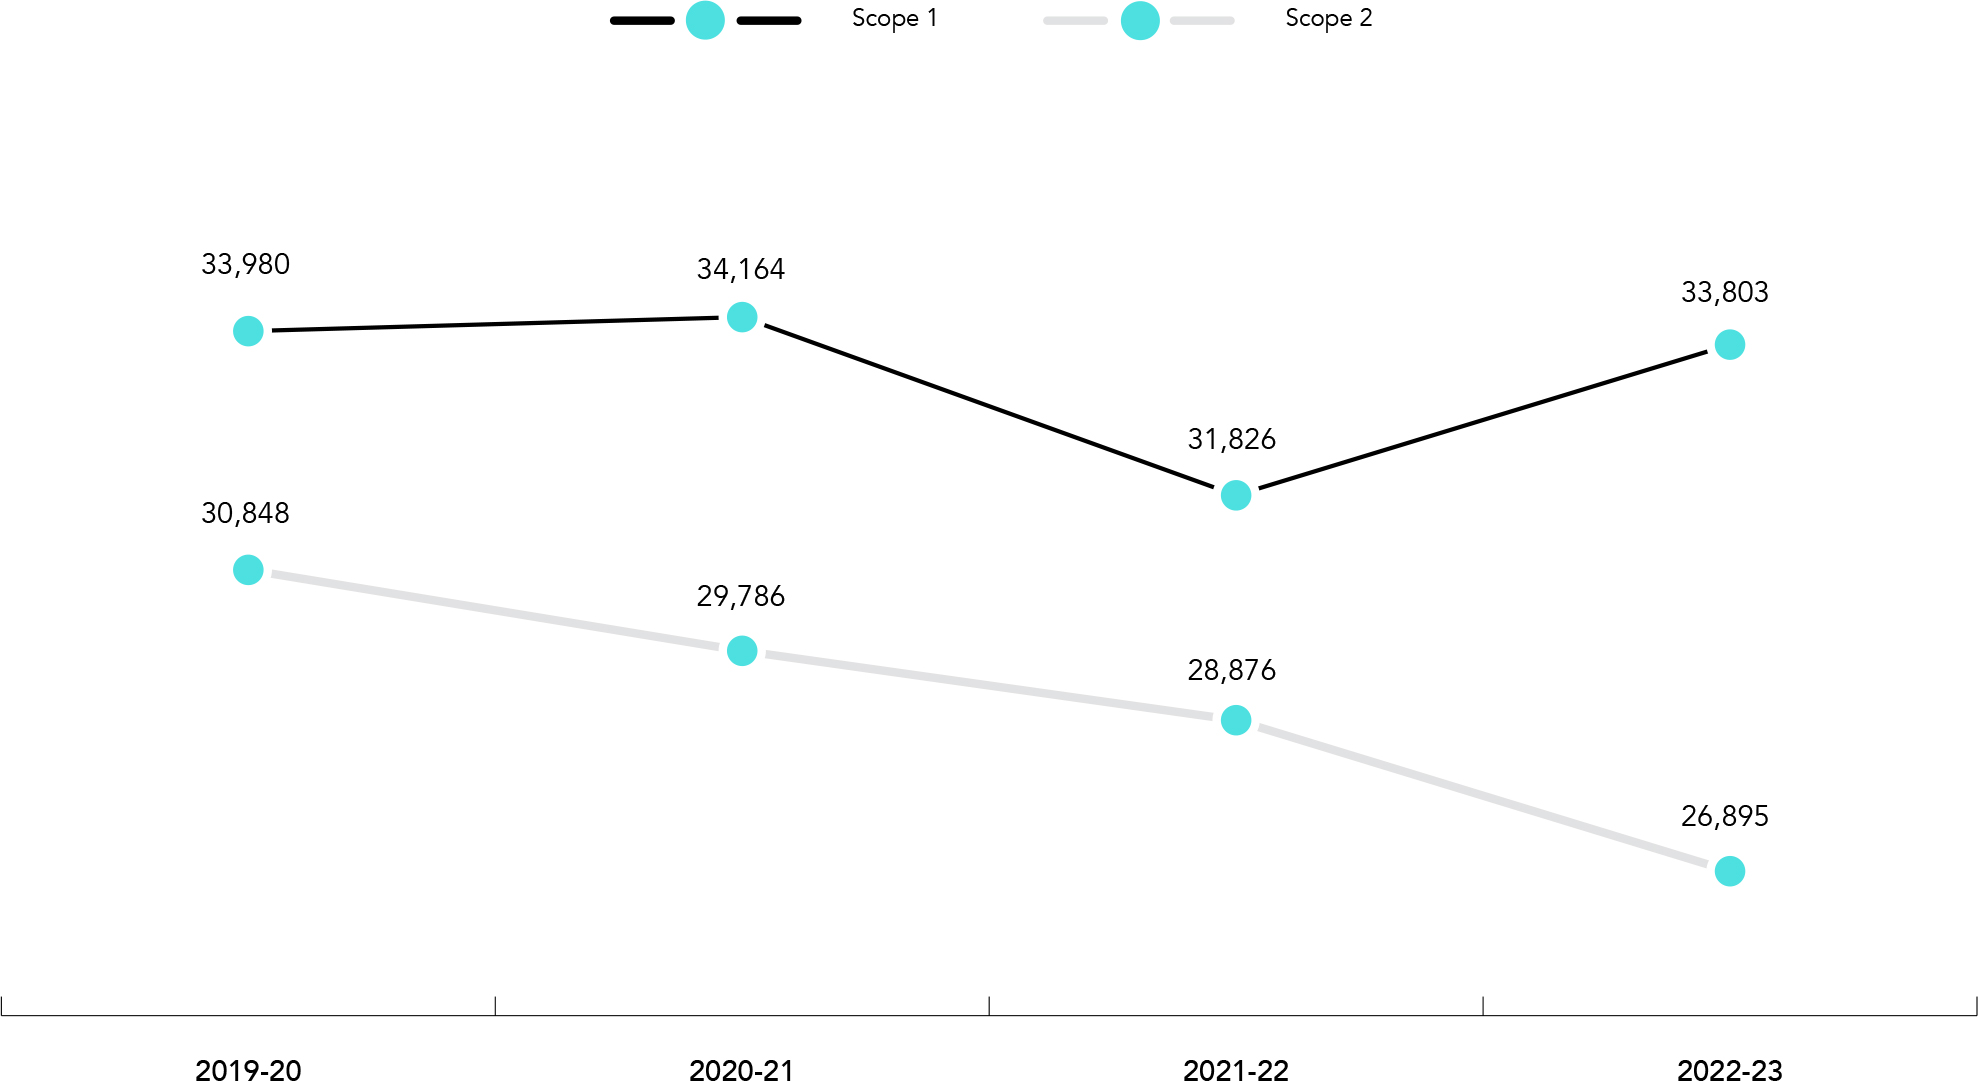
Scope 1 and 2 emissions (MT CO2 equivalent) - India
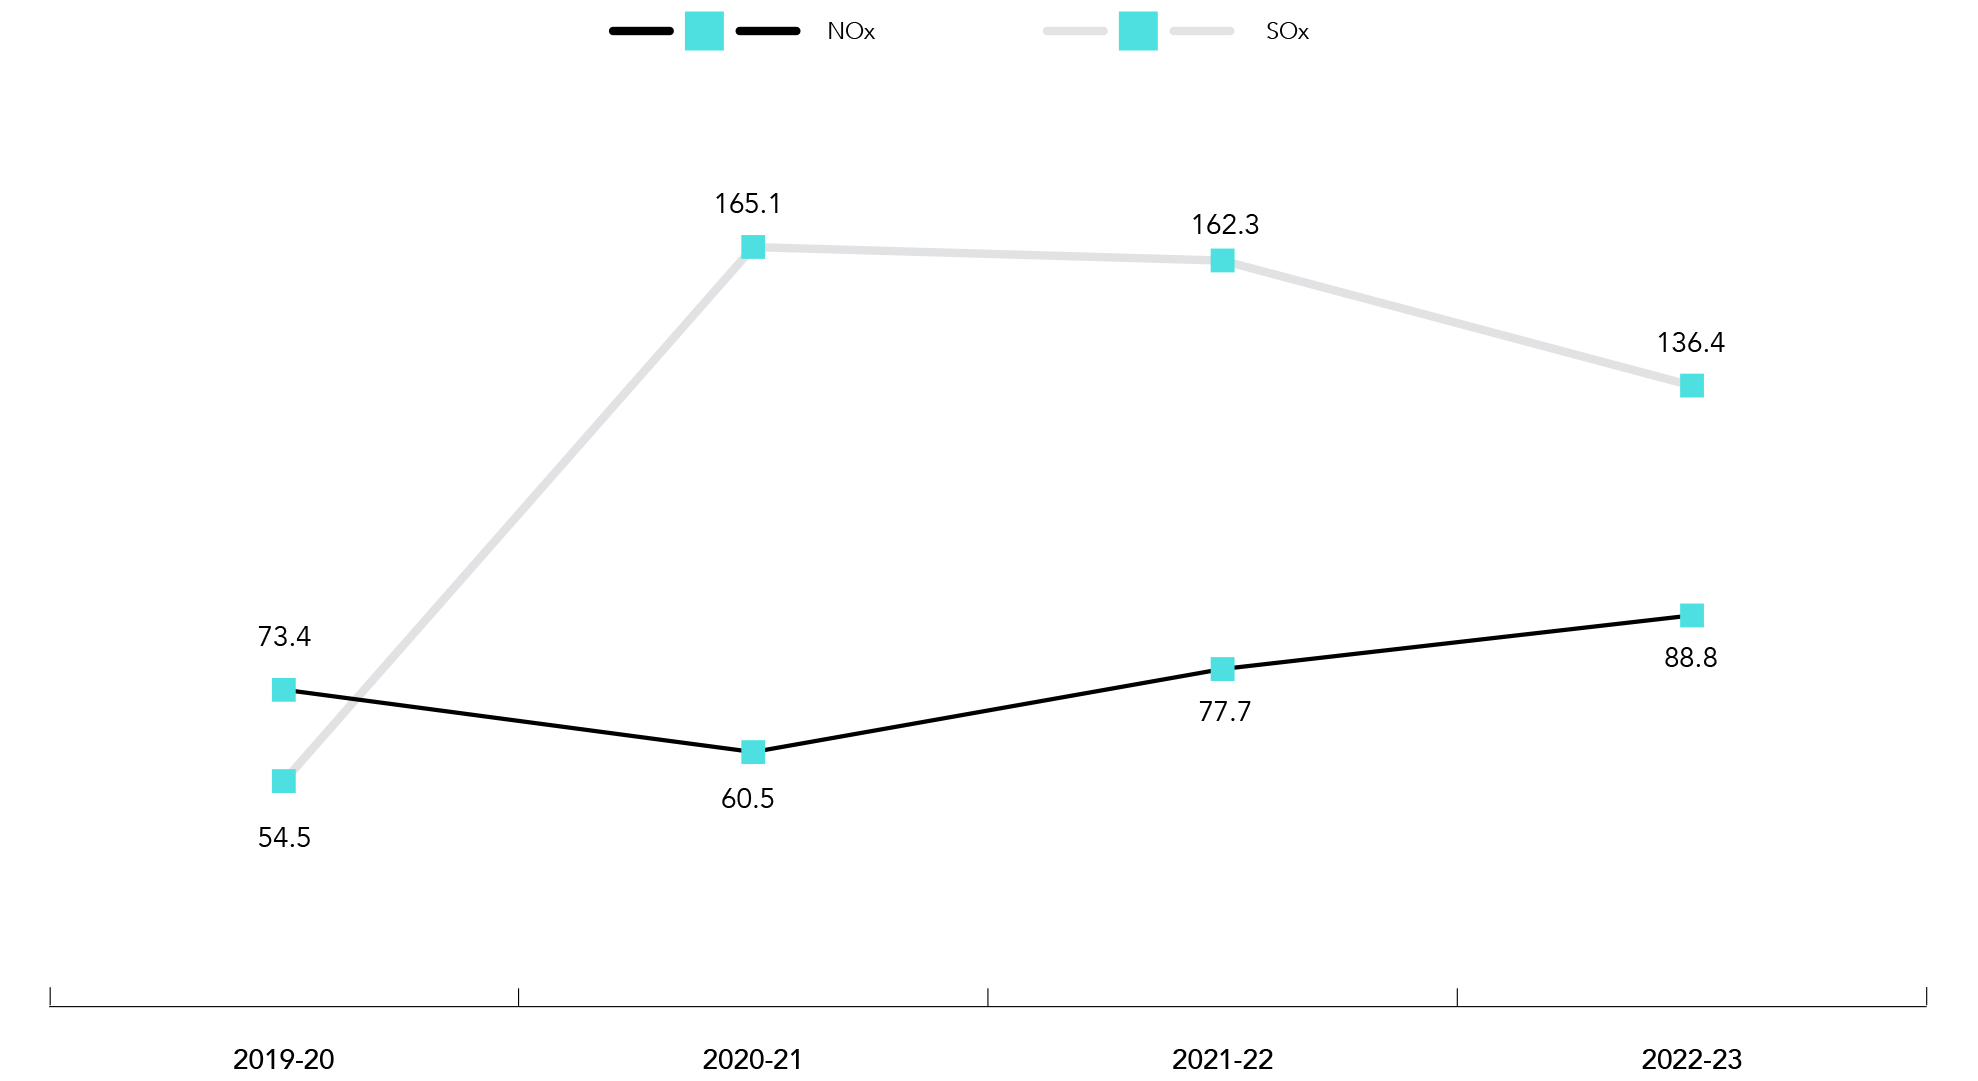
NOx and SOx emissions (MT NOx and SOx equivalent) - India
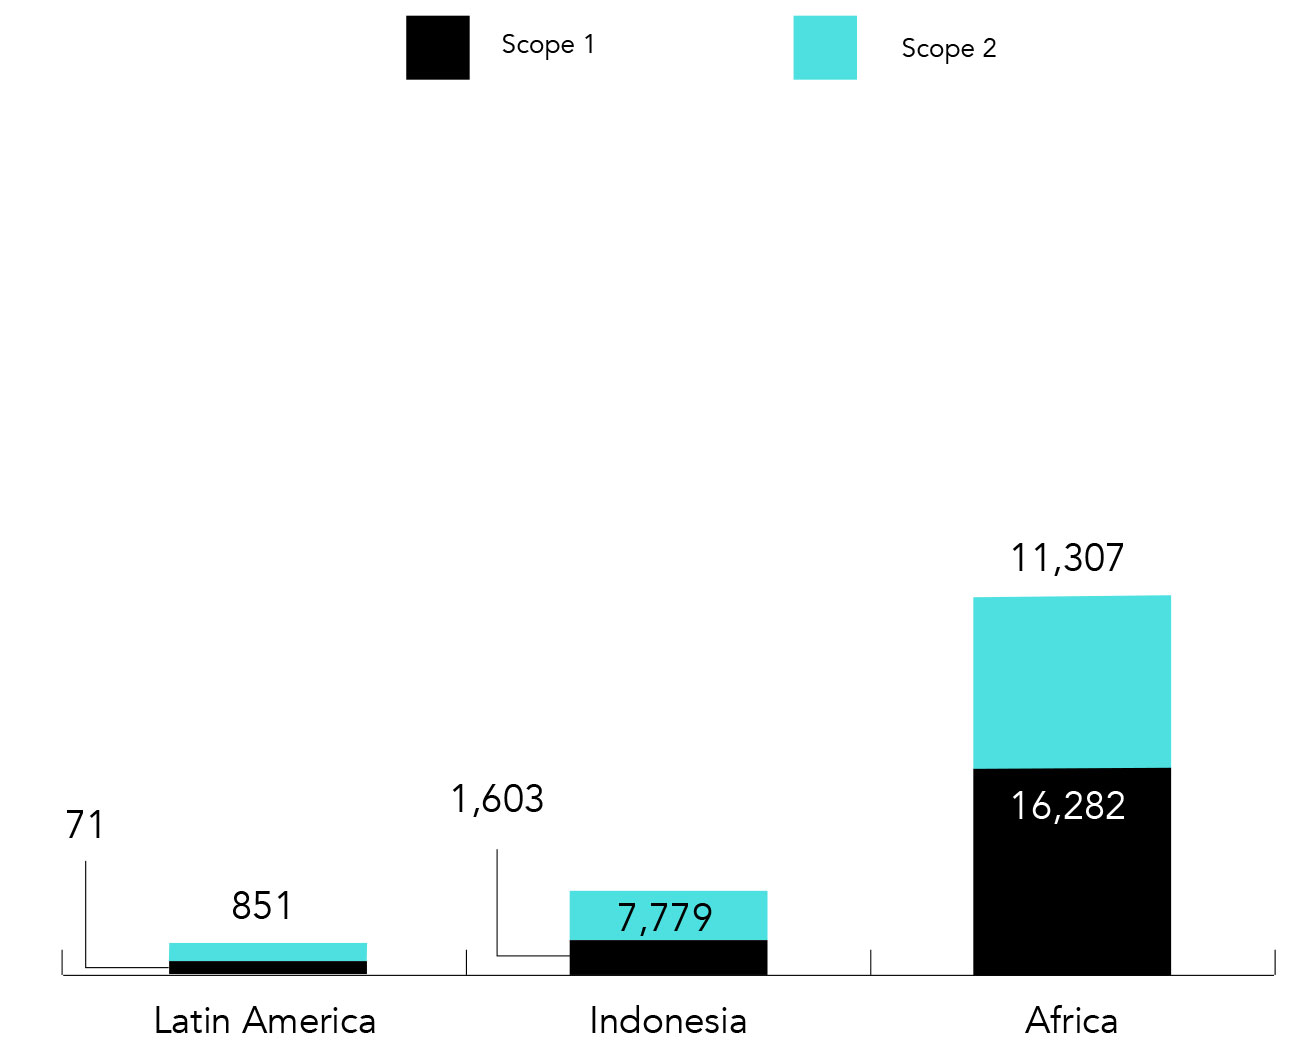
Scope 1 and 2 emissions (MT CO2 equivalent) - Global FY 22-23
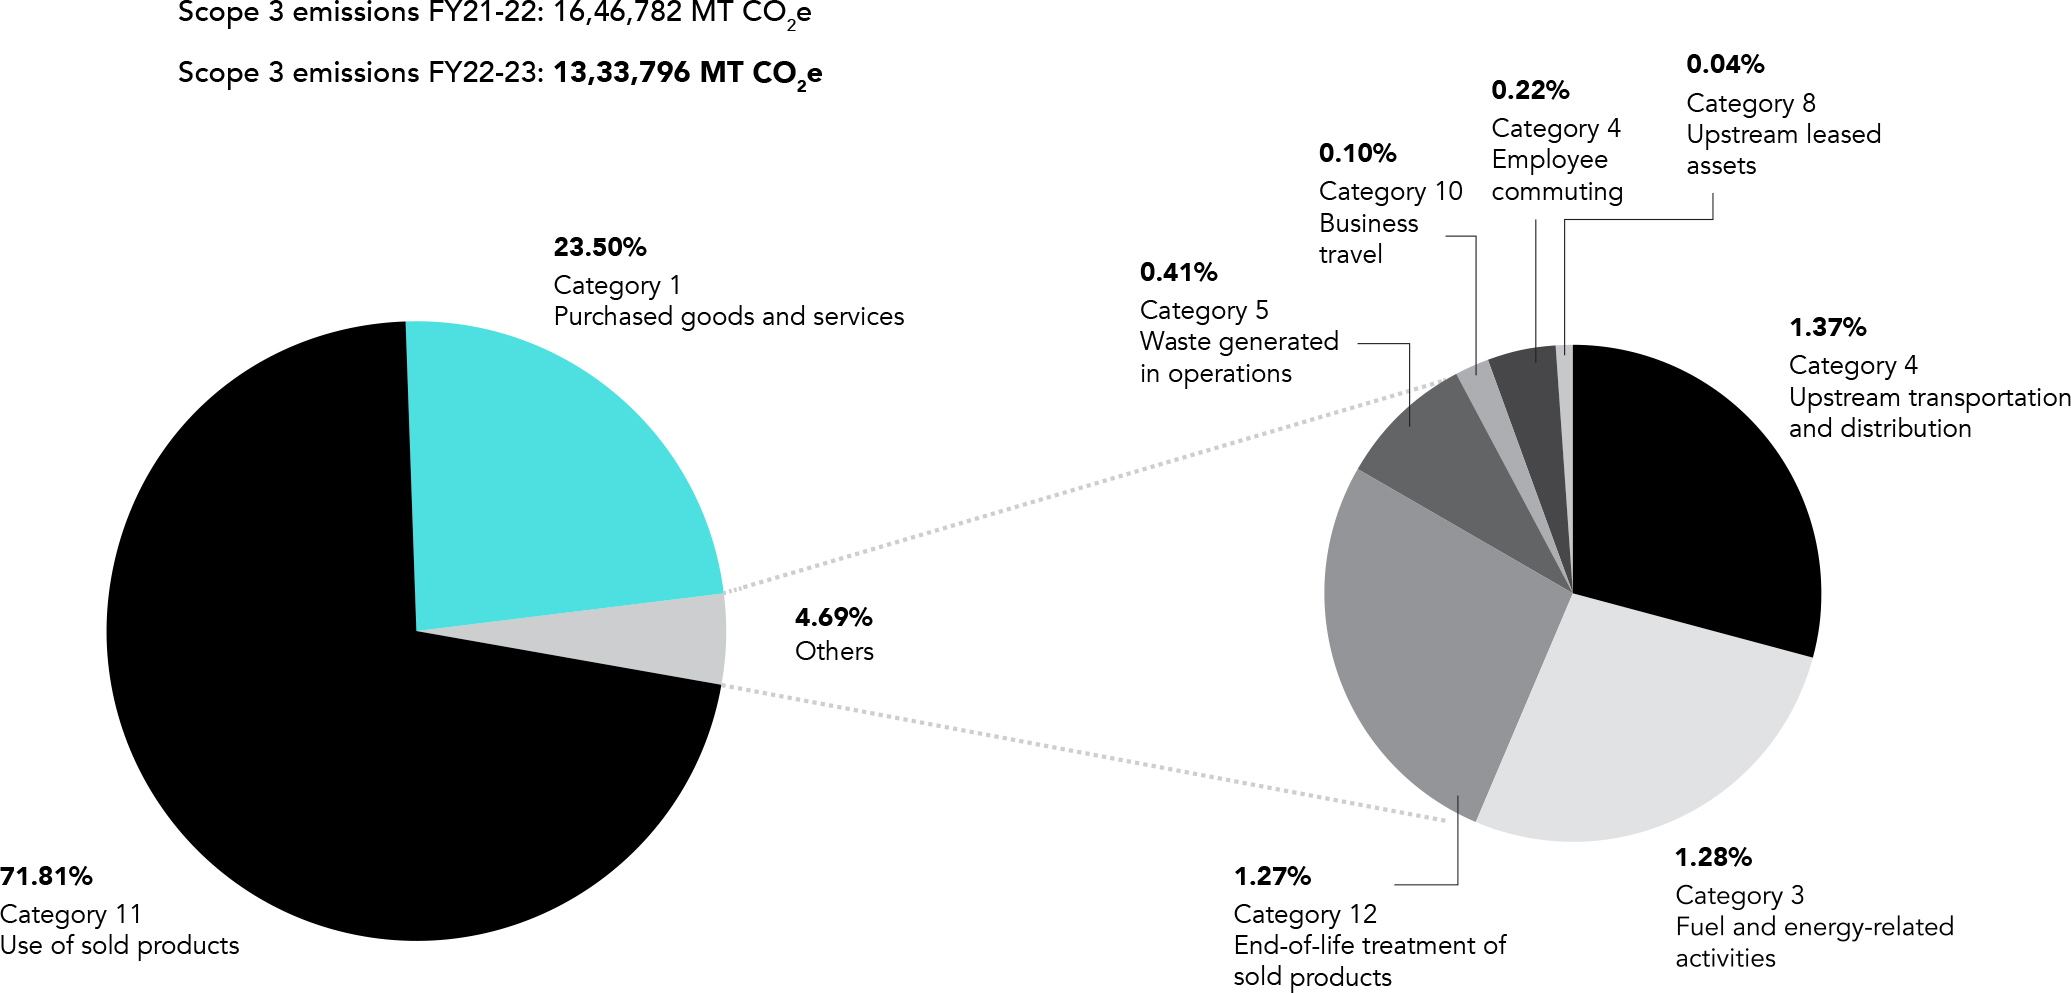
Scope 3 emissions (MT CO2 equivalent) - Global FY 22-23
4. Waste
We undertook several initiatives to reduce waste generation and divert waste from landfill. We continue to send ETP sludge from our Malanpur plant for co-processing at a cement plant and have already achieved a zero waste to landfill status in our India operations.
We are fully compliant with our EPR regulations. Our plastic packaging footprint is approximately 18,750 MT in India. We are plastic neutral, which means we take back the equivalent amount of plastic that we send out to our consumers. In addition, we continue to invest in community solid waste management programmes.
Highlights from the fiscal year 2022-23:
- In Nigeria, we have started diverting waste materials from our manufacturing plants to recycling and in the process we earned over ₹2.9 crore.
- In India, we continue to maintain the zero waste to landfill status.
- In Kenya, South Africa, and Mozambique, we have started diverting waste to recycling.
Moreover, we have reduced our plastic intensity by 17% from 2017. We also intend to use PCR content within our plastic packaging.
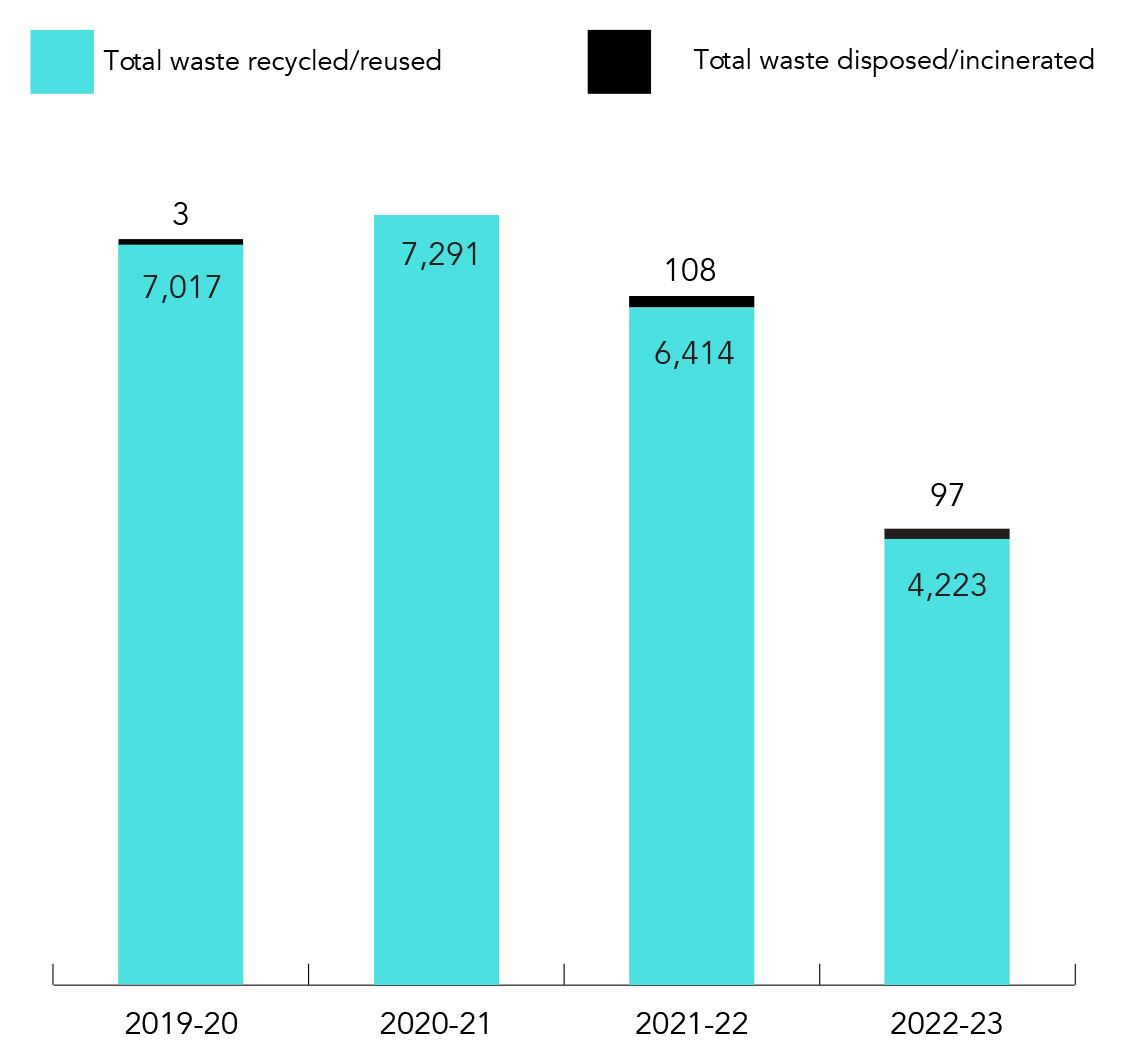
Waste disposal (MT) - India
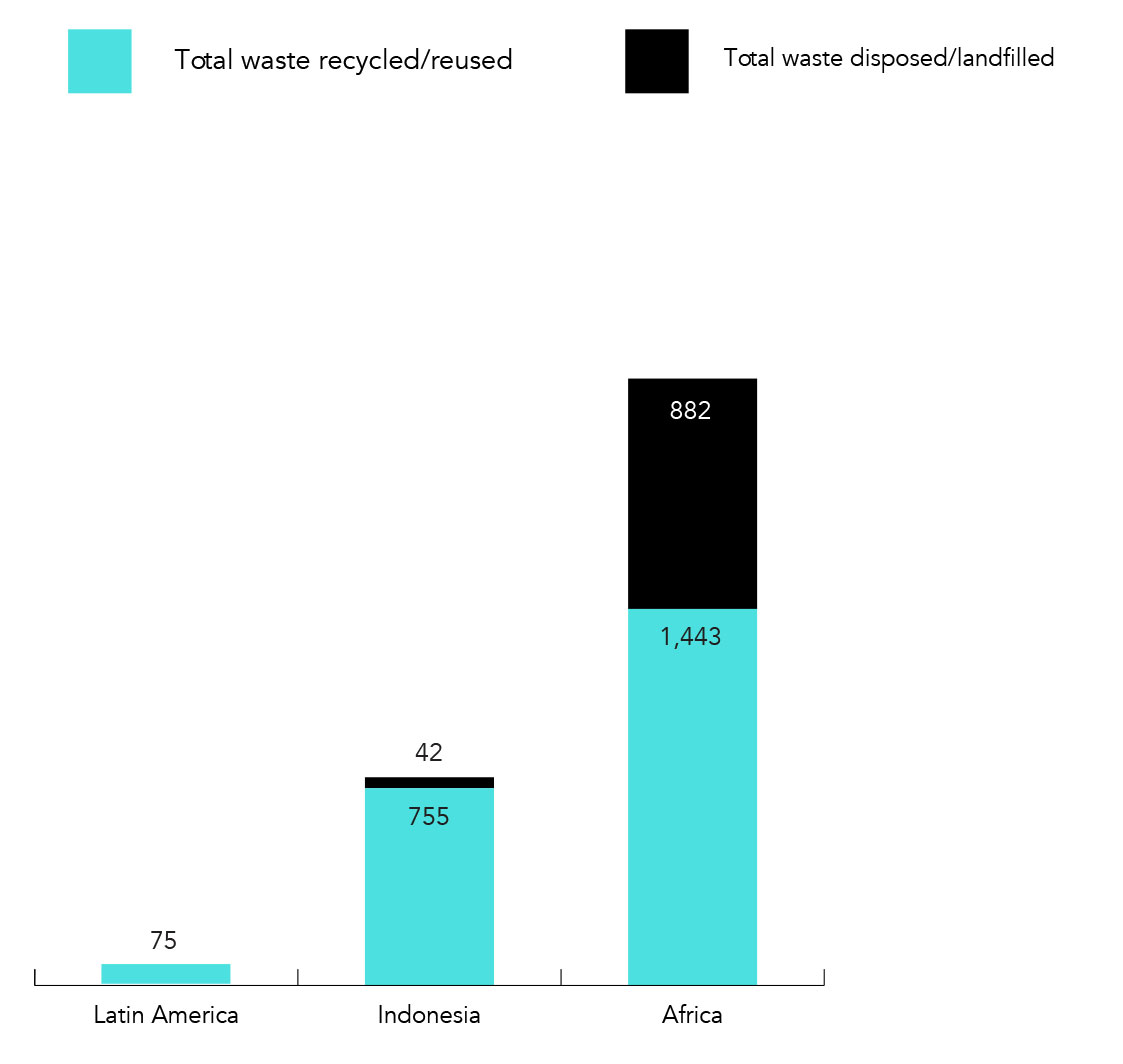
Waste disposal (MT) - Global
Packaging materials (MT) - India
Addressing unmet
consumer needs
We are proud of our strong track record of disruptive innovations, which has allowed us to enter new categories and address unmet consumer needs. Often, this work has also led to the development of new, distinctive memorable brands.
We have adopted a stringent innovation evaluation process that includes rigorous consumer trials and test markets. This process ensures that only the most promising products enter the market. This approach maximises the chances of success, leading to higher returns on investment and long-term value creation for our stakeholders.
Establishing winning products in
new geographies
GCPL’s geographic footprint comprises some of the largest and fastest growing emerging economies in the world. However, our top categories in these countries, such as Household Insecticides, Air Care, and Hair Colour, are underdeveloped, with significant headroom available for growth. We see this as a huge opportunity for value creation via the application of our winning strategies for category development through our know-how in product, communications, and activations.
We are focusing on designing products that cater to local market preferences while also having the potential for global appeal. This enables us to leverage our intellectual capital to create blockbuster innovations that can travel across the world, capitalising on global market opportunities and ensuring long-term competitiveness.
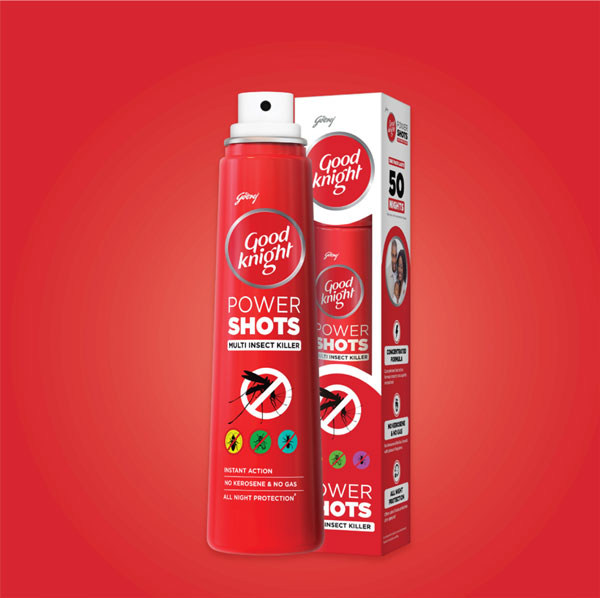
We have already laid the foundation for achieving this goal, cross-pollinating Magic, our revolutionary powder-to-liquid handwash, from India, Africa, Indonesia, and Latin America, making it our first-ever global product. Similarly, we forayed into the Household Insecticides category in Africa with the launch of Goodknight Power Shots.
We forayed into the Household
Insecticide category in Africa with the
launch of Goodknight Power Shots
Enhanced, digitally
enabled consumer insight
Central to our innovation strategy is our commitment to consumer centricity. By augmenting our consumer insight capabilities, we empower our innovation team to develop products and solutions that resonate with consumer needs and preferences.
Our enhanced consumer insight capabilities include:

1. Global structure
By fostering a global category structure that promotes the sharing of insights and know-how across the organisation, we tap into a wealth of knowledge that drives better-informed decision-making and strategic planning.

2. Standardised testing protocols
Implementing clear global testing protocols and action standards ensures consistent, high-quality evaluation of our products and innovations, minimising risks and maximising the chances of success in the market.

3. Strong agency partnerships
Building deeper relationships with critical agency partners helps us leverage their expertise and global scale, further enriching our intellectual capital and supporting the development of products that cater to diverse consumer preferences.

4. Digital techniques
Harnessing new-age digital techniques for consumer insights allows us to gather real-time data, identify emerging trends, and react swiftly to changing consumer demands. This agility contributes to our competitive advantage and long-term growth potential.
Investments in R&D, design,
technology, and skills
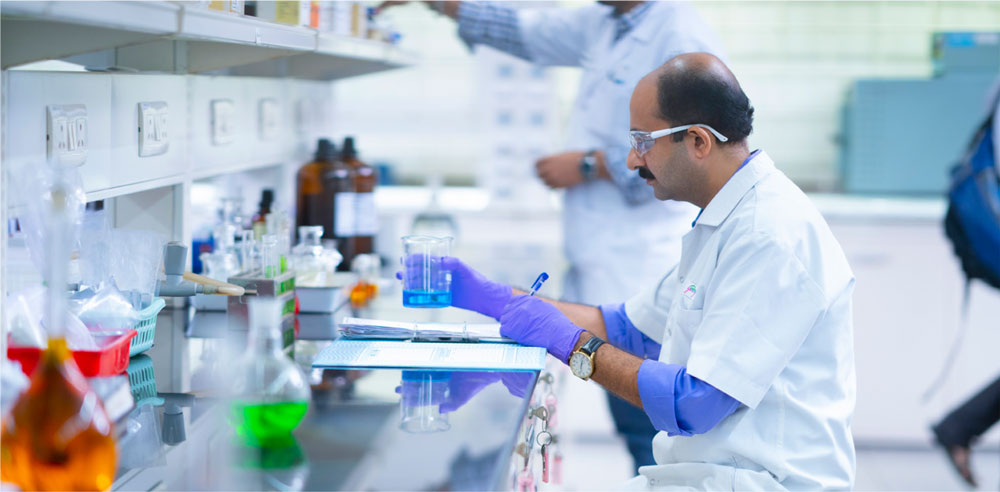
Our state-of-the-art R&D centre at our global headquarters, Godrej One, in Mumbai, is supported by local R&D teams who partner across geographies and share learnings. At our in-house global Design Lab, we integrate design thinking and transform product capabilities. While this is usually a capability outsourced in FMCG, we have chosen to build it internally and make it a competitive advantage. The lab comprises highly skilled graphic and industrial designers across geographies collaborating on projects.
Our state-of-the-art global R&D centre at
our headquarters, Godrej One in Mumbai is
where we lead new product development
Sustainability built into our
products from Day 1
We continuously assess the sustainability of our products from a life cycle perspective and use the insights to constantly re-shape and strengthen our NPD framework. This is also informed by the quantitative and qualitative insights received through market research, focus groups, consumer panels, and analytics. Our R&D will continue to play a crucial role in creating innovative, high-quality products that are good for the people and the planet.
1. Reconstitution portfolio
Our reconstitution portfolio plays a critical role in creating innovative, high-quality products that benefit both our customers and the environment.
Due to the high-water content of personal care products, tonnes of water are shipped before production, and the finished product is heavier while it is transported.
Magic handwash is a powder-to-liquid handwash, and Magic Bodywash are liquid concentrate products that allow consumers to themselves add water to the concentrate, transforming the product into a usable liquid form.
With Magic powder-to-liquid handwash, our sustainable and affordable
solution to handwashing, we are driving change in consumer behaviour
and fostering a greener, more responsible market.
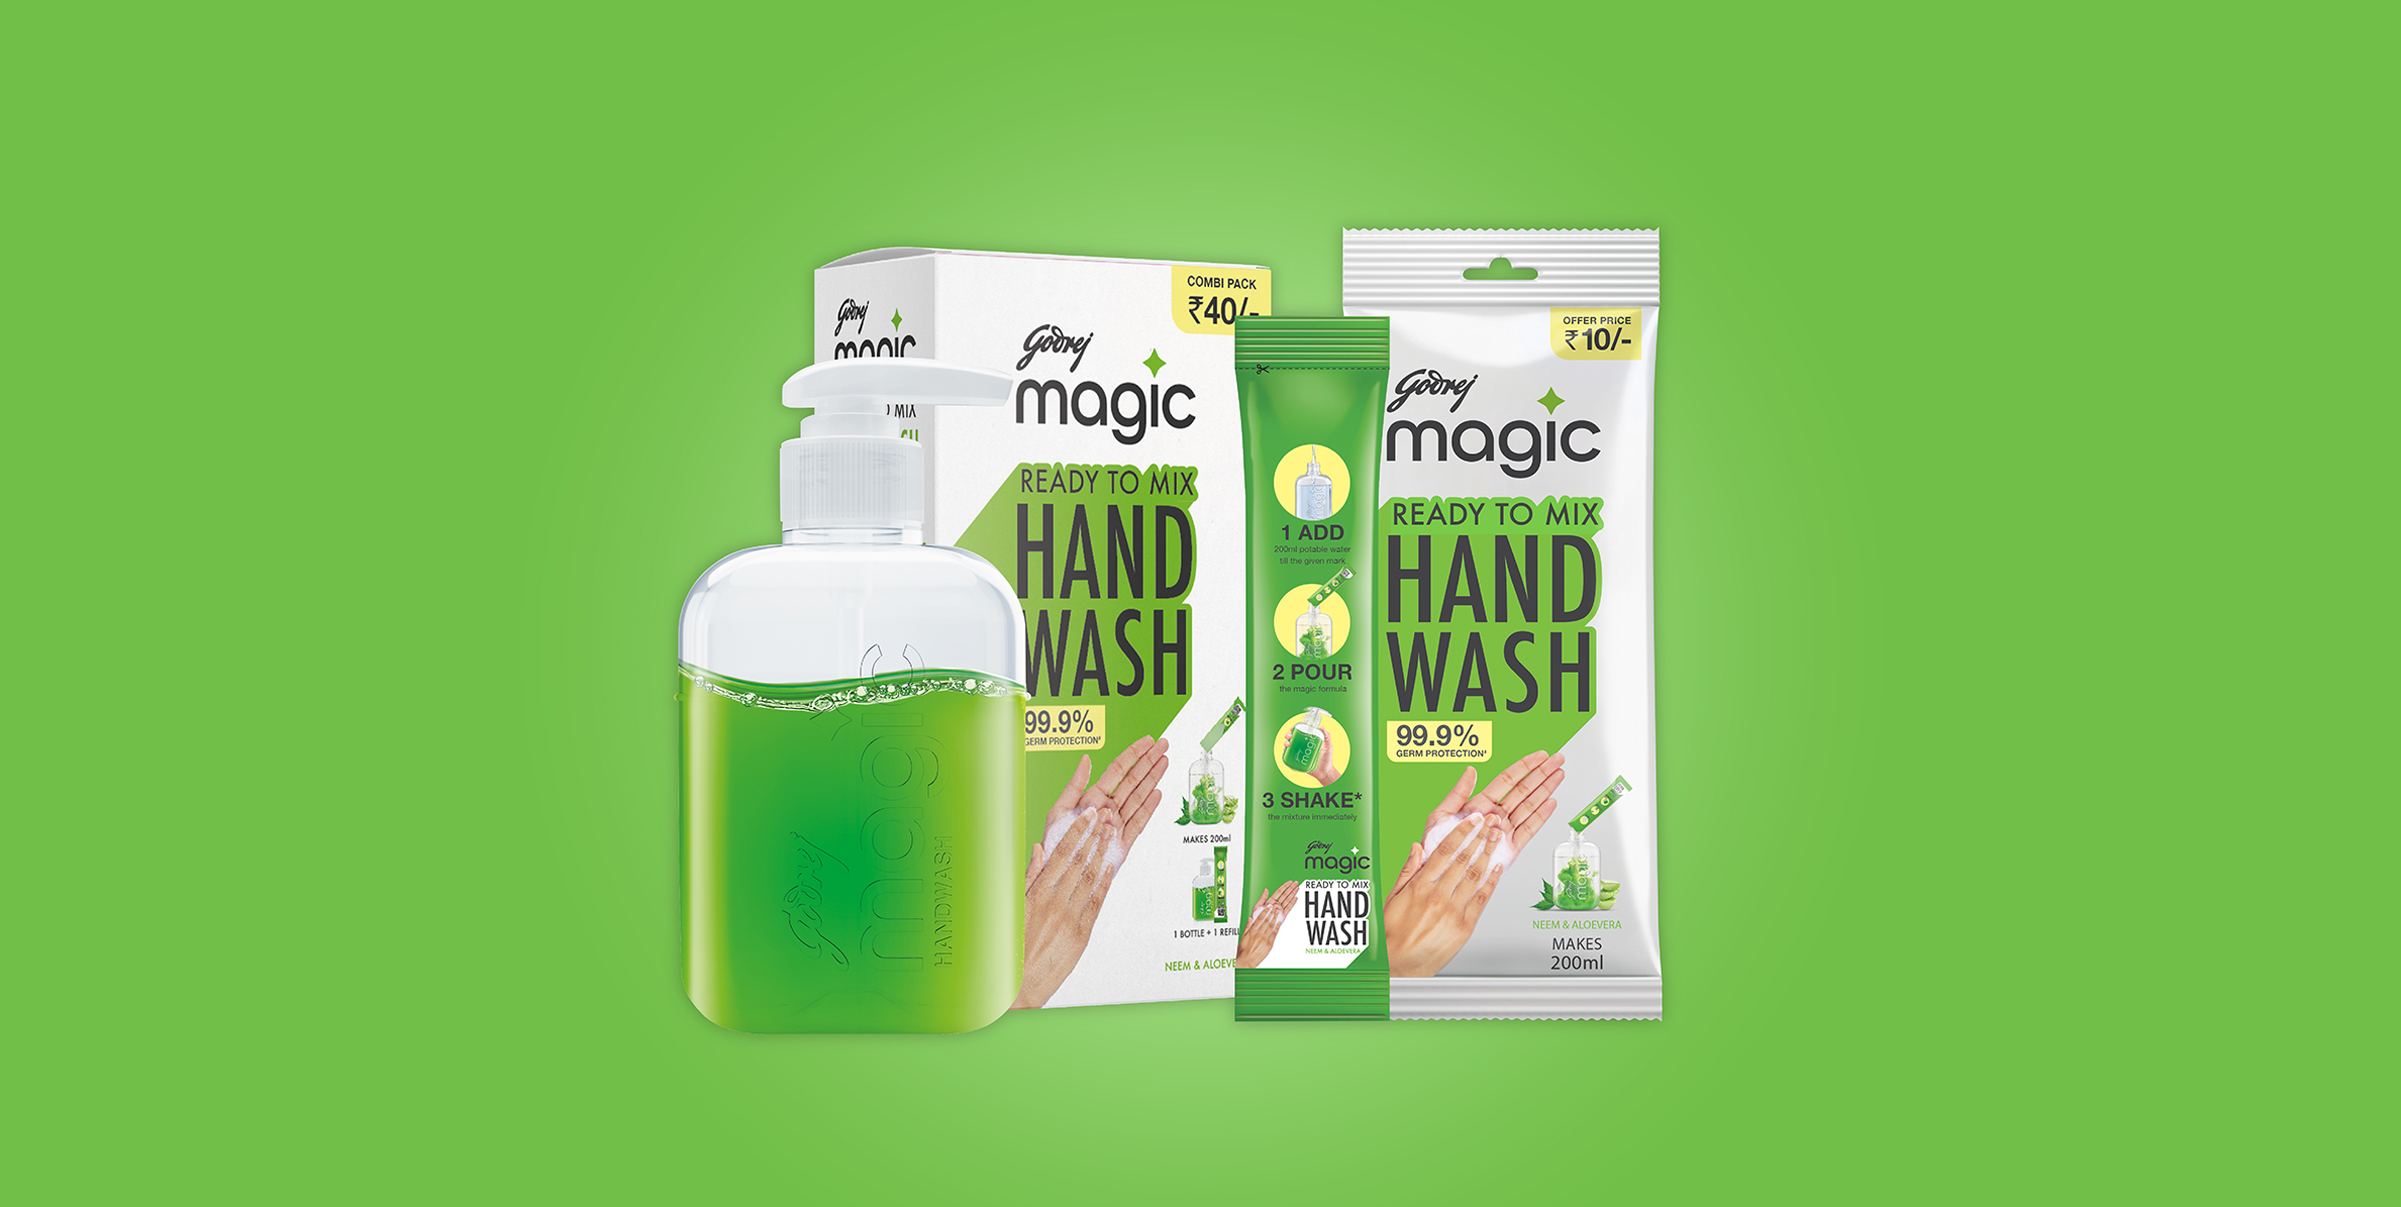
This approach has several substantial advantages for the planet. First, by removing water from our products, we reduce the overall weight of our product. This allows us to transport larger quantities of our products with reduced packaging requirements. Consequently, our reconstituted products require 84% less plastic packaging compared with the traditional liquid versions of the same quantity. This reduction in packaging minimises plastic waste as well as leads to a more sustainable supply chain.
Second, the lighter weight of our reconstituted products results in a 44% reduction in fuel consumption during transportation. In turn, this translates to a 44% decrease in emissions caused by the transportation of our products to consumers. By reducing packaging, fuel consumption, and emissions, we are ensuring positive impacts on the environment while continuing to deliver high-quality, delightful products to our consumers.
Usually, environmentally friendly products and packaging often come at a premium price, catering primarily to a niche market of environmentally conscious consumers.
However, we firmly believe that the future belongs to sustainable products accessible to a larger audience. Our products are priced affordably, and we are committed to offering our innovative, eco-friendly products at a green discount rather than a premium price. We intend to make sustainable choices more appealing and affordable, driving a positive change in consumer behaviour and fostering a greener, more responsible market.
2. Natural portfolio
We have developed products that are crafted primarily with natural ingredients to differentiate our products from those already available in the market and improve our market position. We have developed at least one natural product in each of our categories.
Household Insecticides belong to a highly regulated product category that needs adequate regulatory approvals before launch. However, many spurious mosquito repellent incense sticks (agarbattis) are available in the market today.
They do not declare all ingredients and contain harmful chemicals. They are not approved by the Government of India’s safety norms. When inhaled regularly, they can cause respiratory problems, especially in children and elders. Our Goodknight Naturals Neem Agarbatti is composed of 100% natural neem and turmeric. It repels mosquitoes effectively and is safe for use as it meets all necessary governmental approvals.
Our other examples include our natural Household Insecticide products, Goodknight coils, liquid vapouriser, and personal mosquito repellent. Our Hair Colour brand, Godrej Nupur, is a natural henna-based hair dye. Our brands in Africa (TCB, Megagrowth, and African Pride) and Indonesia (Stella and Mitu) have variants that contain natural ingredients such as aloe vera and almond.
Goodknight Naturals Neem Agarbatti is
made of 100% natural neem and turmeric

Supply chain
sustainability
According to our Good & Green goals, which we defined in 2015, we have put in place our sustainability commitment expectations for our suppliers. This is detailed in the GCPL Sustainable Procurement Policy. All our key suppliers are expected to align with it and we are committed to enabling them to get there. Existing and new suppliers are expected to conform to the expectations listed under the Policy.
We are committed to helping our suppliers make their operations more sustainable with a focus on four parameters:

Ethically driven
- Business integrity
and ethics - Human
rights
- Accountability and responsibility
- Legal and regulatory compliance

Social focused
- Responsible conduct with stakeholders
- Employee health and safety
- Local community development

Green inspired
- Green products and processes
- Reduce, reuse, and recycle
- Adopting green initiatives and practices

Quality Centred
- Quality management systems
- Facility and machinery
- GMP and
quality controls - Material
management
As part of our supplier scoring process, we have collated qualitative and quantitative data and developed a composite score based on the responses. To drive continuous adherence, we have scheduled self-declarations from suppliers, as well as external audits by a consultant. We have identified category-wise targets, shared industry best practices, and suggested corrective actions and improvement plans.
The progress on supplier assessment is periodically shared with the Board ESG Committee. With this accountability, we ensure suppliers are aligned to our Sustainable Procurement Policy and its code, and there are no conflicts with ESG requirements.
As part of supplier assessments in India, we evaluated 119 suppliers in the fiscal year 2022-23 (accounting for approximately 71% of our procurement spends) on being quality-centred, ethically driven, green inspired, and socially focused.
Of 114 vendors with historical scores, we saw an overall average 7.8% improvement in scores and 63 vendors exhibited a positive improvement. None of the vendors exhibited any non-compliance or substantial actual and potential negative impacts. Hence, no suppliers were put on corrective plan or were terminated.
To drive continuous improvement, we have shared industry best practices and suggested actions. We are also going to start capacity building of suppliers with whom we engage to help them further their sustainability journey. Additionally, the sustainability assessment conducted using a self-declared questionnaire has become part of our new vendor initiation protocol.
Supplier screening for fiscal year 2022-23
538
Total number of
Tier-1 suppliers
125
Total number of
significant suppliers
in Tier-1

125
Total number of significant suppliers
(Tier-1 and non -Tier-1)
71%
Total spend on significant suppliers in Tier-1
0
Total number of significant suppliers in non-Tier-1