


Strategic Priorities
- High customer service levels through ready availability of a diverse product range
- Best-in-class value delivery to customers at optimised costs
- Freshness of products supplied to consumers
Capitals Impacted
-

Manufactured
Capital -

Financial
Capital -

Human
Capital -

Intellectual
Capital -

Social and
Relationship
Capital -

Natural
Capital
Risks
- Supply chain risks due to the pandemic
- Commodity inflation
- Labour-intensive product portfolios in some geographies
- Potential disruption due to political risks
- Localised competition
- Regulations
Enablers
- Shop floor employee engagement and workplace safety
- Localised manufacturing technology
- Dispersed manufacturing footprint
- Engagement with our business partners and suppliers
- Good & Green vision
Key Focus Areas
- Customer service
- Employee engagement and productivity improvement
- Industry 4.0
- Sustainability of the process
Key Impact Areas
- Bottom line growth
- Customer service
- Environment
- Community
Material Issues Impacted
- Sustainable packaging
- R&D
- Building inclusive and prosperous communities
- Occupational health and safety
Value Created
Our future-ready investments are aimed at achieving process efficiencies, leveraging economies of scale, and impacting speed to market. This helps us being more competitive in the market, directly impacting our Manufactured Capital, and consequently, strengthening our Financial Capital.
We are enhancing our Intellectual Capital by scaling up technology and capabilities and evolving best practices. We are also building smarter, safer work environments in line with global standards to enable our team members to deliver more efficiently and improve Human Capital.
We work closely with our partners and suppliers and together reach out to our wide consumer base and build Social and Relationship Capital. Our work impacts the environment, and we are constantly working to improve the sustainability of our process and make a positive impact on Natural Capital.
United Nations’ Sustainable Development Goals
For more details, refer to the sustainable development goal mapping on our website
- Saved over ₹3 crore in the fiscal year 2021-22 through sustainable manufacturing
- Stock availability in India is 96.84%
Supply chain
strategic priorities
- 1.Incorporating best practices and strengthening supply chain processes across geographies to become more agile
- 2.Extending shop floor employee engagement initiatives to international businesses
- 3.Building a safe workplace through training and capability building
- 4.Sustainable manufacturing and supply chain practices, thereby resulting in significant improvements in energy and water consumption, carbon footprint, waste generation, and renewable energy across the value chain
- 5.Working on cutting-edge replenishment practices
- 6.Responding to constantly changing consumer demand patterns, thereby leading to high fill rates
- 7.Improving the ‘freshness’ of products for sale, better logistics practices, product traceability, and reduced obsolescence
- 8.Increasing manufacturing capacity across geographies through fresh investments and de-bottlenecking of capacities
- 9.Enhancing the IoT in manufacturing and logistics
Key focus areas
and initiatives
- 1.Customer service
- Focusing on agile fulfilment initiatives to respond efficiently to changing consumer demands
- 2. Employee engagement and productivity improvement
- Extending best practices and shop floor employee engagement globally
- 3.Industry 4.0
- Making future-ready investments to further improve productivity
- 4.Sustainability of the process
- Driving sustainability initiatives across the supply chain and extending them to key vendors through sustainable procurement policies
1. Customer service
Focusing on agile fulfilment initiatives to respond efficiently to changing consumer demands
We had a strong rebound in our service level across all our regions. This helped us mitigate the disruptions caused by the pandemic.
We rolled out multiple digitisation initiatives at our manufacturing and supply chains. We setup the Transportation Management System in our logistics to manage our entire transportation operations, lower freight costs, and optimise routes and loads. We automated scheduling and planning to integrate our supply chain to run majority of processes and decisions in real-time. We have also made progress on crucial projects on future network footprint for our distribution network and replenishment-driven sales for our distributors.
Cumulative fill rates across geographies
| Country | Fill rate of FY 21-22 (%) |
|
|---|---|---|
| India | 96.84 | |
| Indonesia | 98.80 | |
| Argentina | 98.70 | |
| Chile | 95.00 | |
| Kenya | 95.20 | |
| South Africa | 82.59 | |
| Nigeria | 89.00 | |
| Ghana | 87.60 | |
| Tanzania | 94.40 | |
| Mozambique | 97.00 | |
| USA | 92.70 |
In line with demand patterns, we focused on improving the agility of our manufacturing capacity across geographies.
In our manufacturing and supply chain, we have also adopted sustainable practices such as using renewable energy resources at our manufacturing sites and increasing rail mode of transportation for our stocks, among many other initiatives.
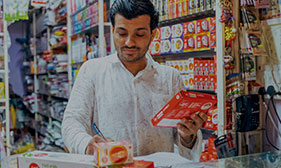
To cater to the shifts in consumer purchasing habits, we have enabled demand-led forecasts for growing our organised trade channels.
2. Employee engagement and
productivity improvement
Extending best practices and shop floor employee engagement globally
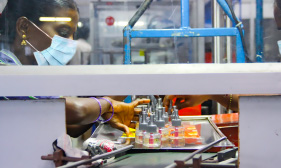
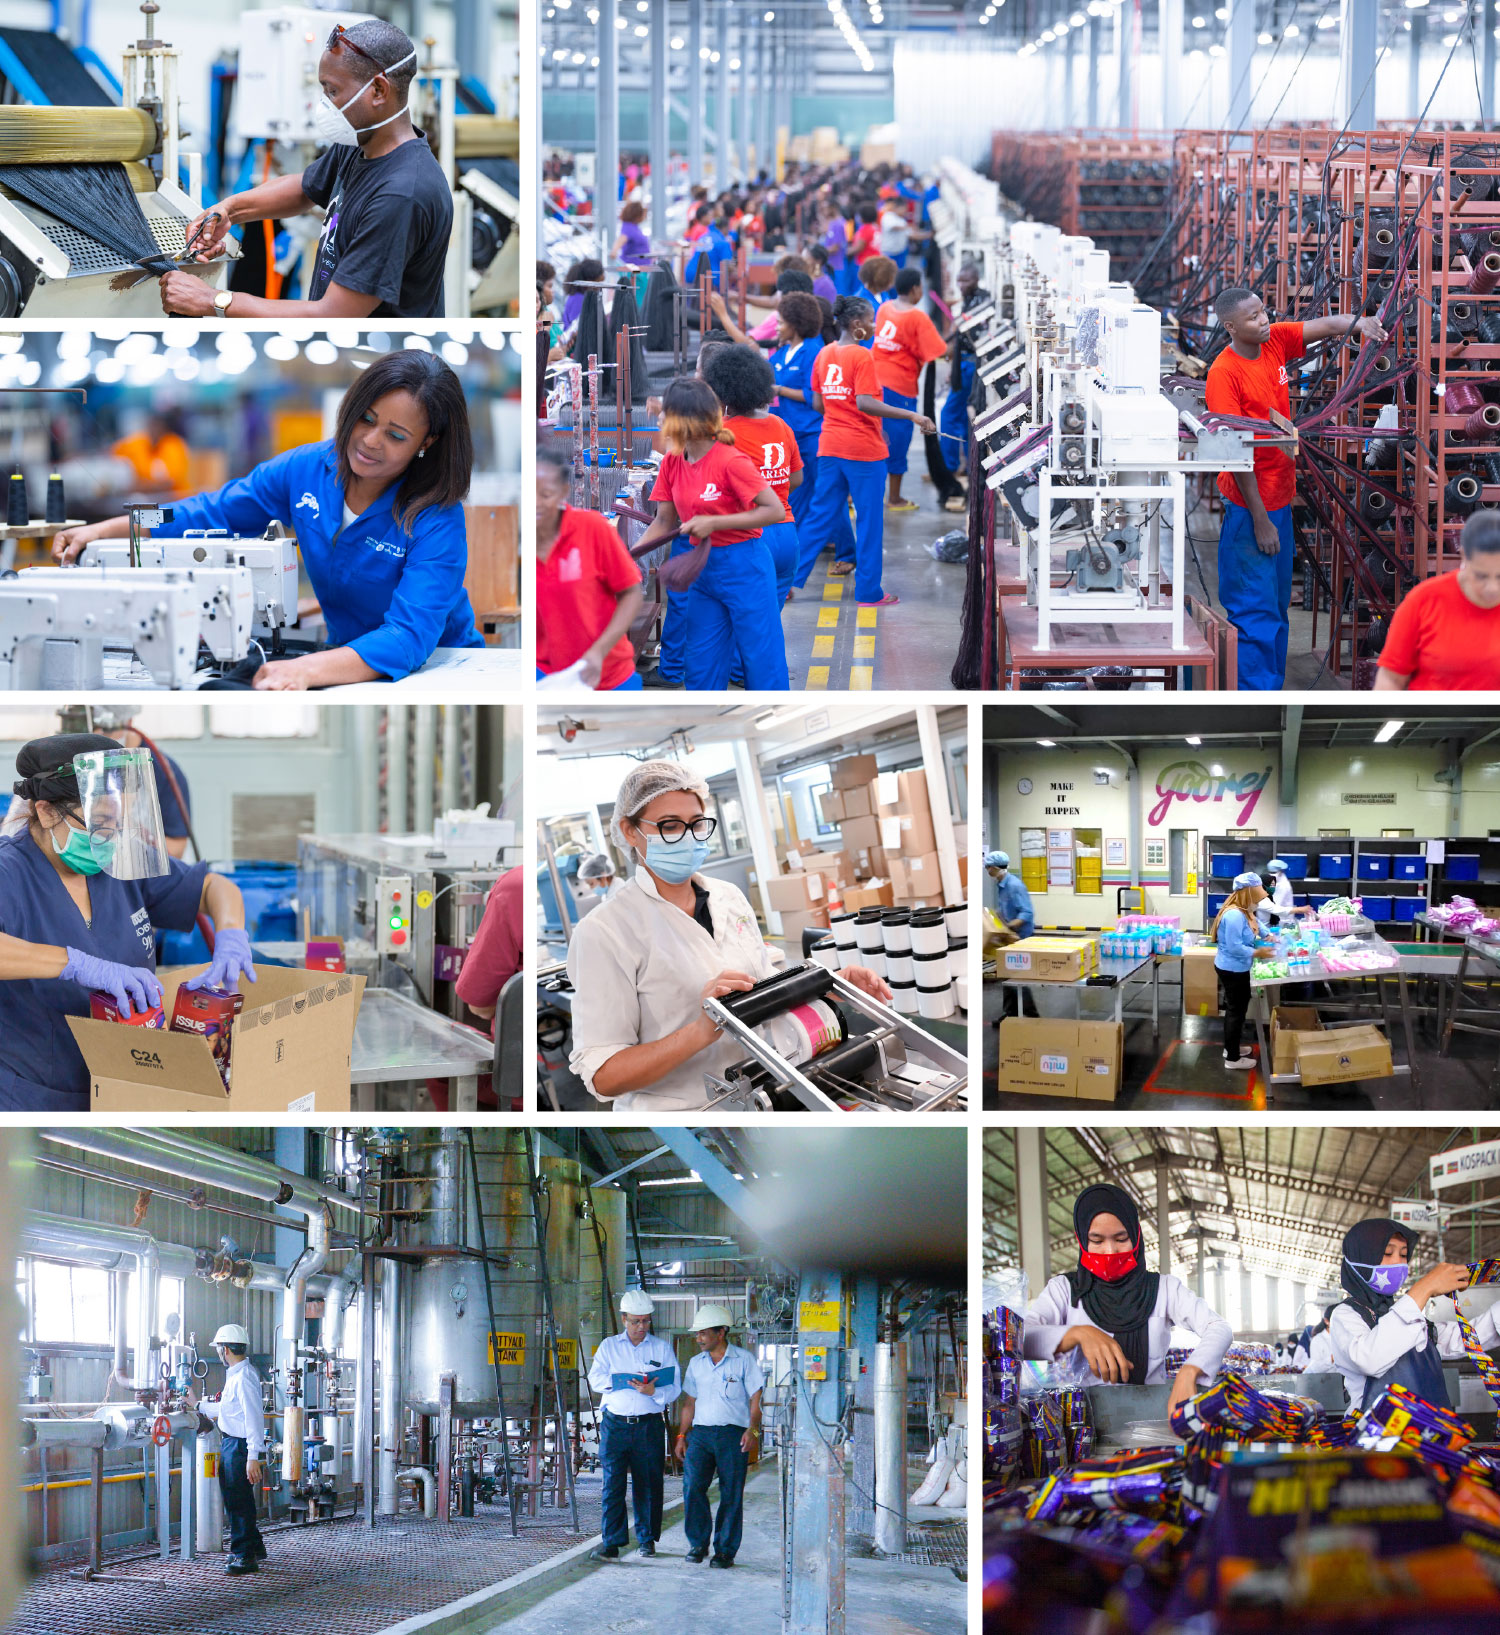
We have adopted best-in-class manufacturing practices such as Theory of Constraints, TPM, Lean, Kaizen, and low-cost automation, across our global supply chain from procurement through manufacturing and shipping.
We are constantly exploring new technologies and solutions to improve the utilisation of our assets, materials, and resources to ensure enhanced freshness of our products.
A. Total quality management
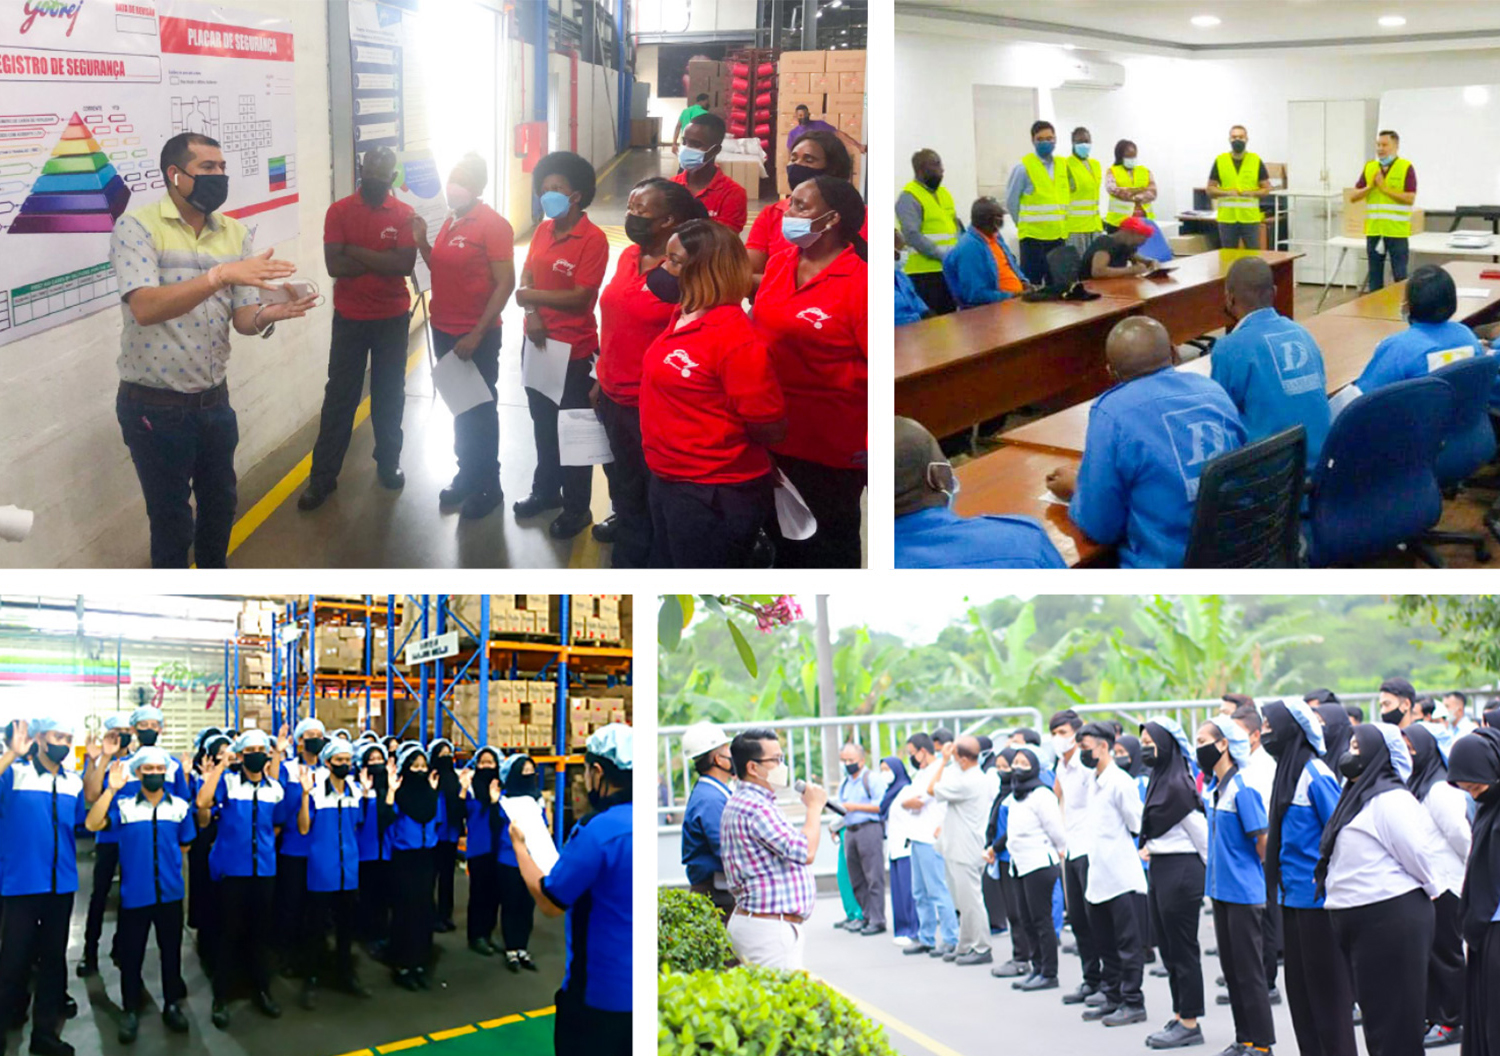
We drive total quality management through shop floor employee engagement initiatives across geographies. As a part of this initiative, we train all shop floor employees in TPM, Lean, Quality Circles, Task Force, and Kaizen.
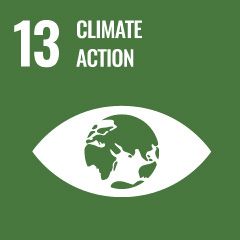
Our leaders engage with
shopfloor employees
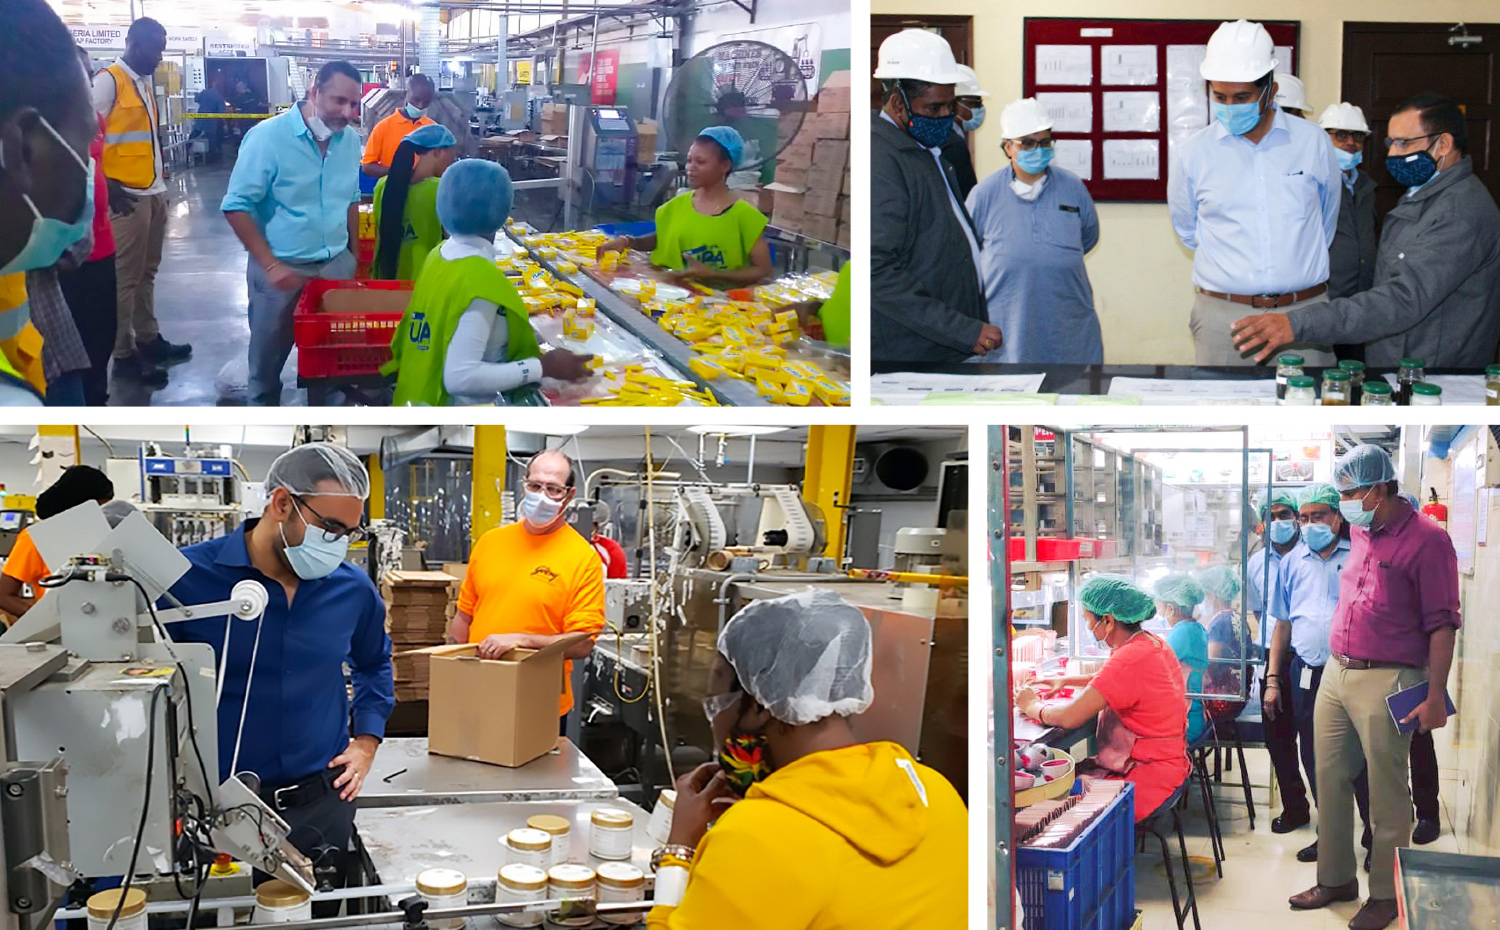
Our leaders engage with
shopfloor employees
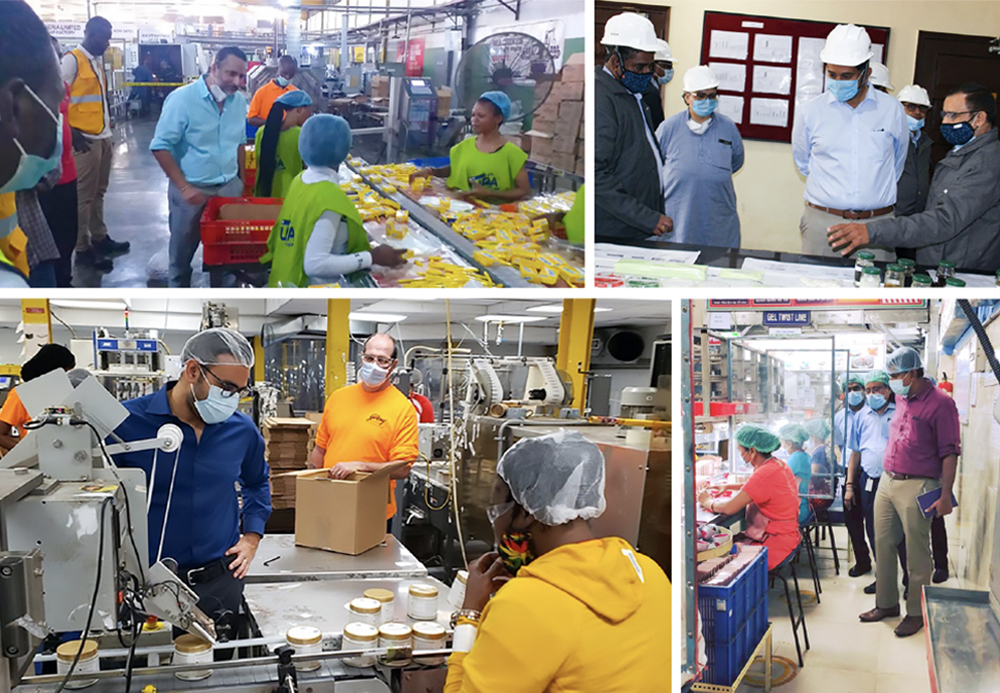
Safety awareness initiatives organised by
our Africa and Indonesia factory teams
B. Productivity and safety improvement
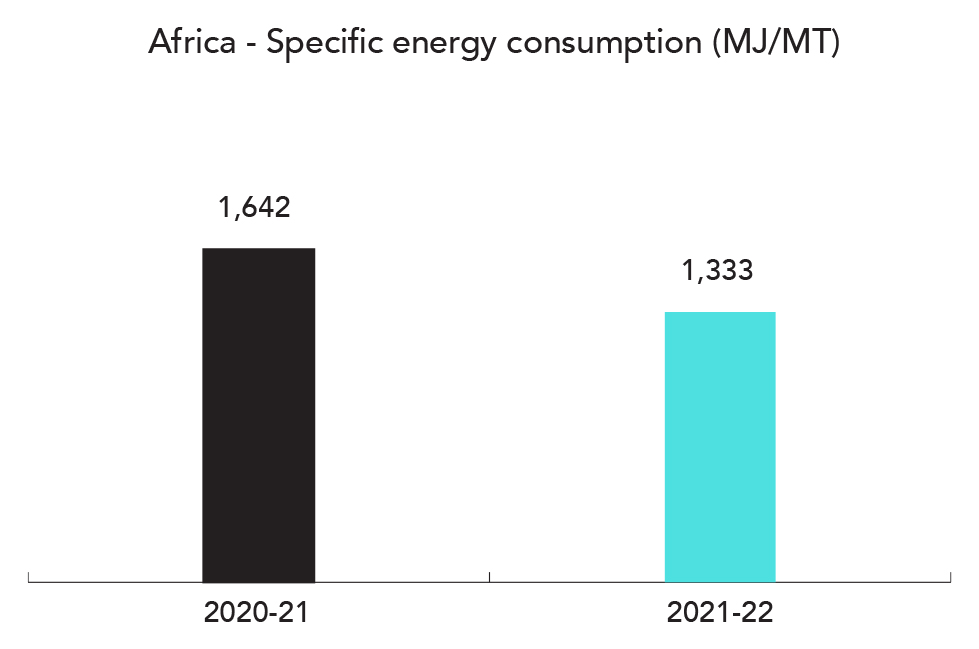
In fiscal year 2022, we engaged with nearly 26,700 shop floor team members in Africa to improve manufacturing safety processes, employee connects, and relations.
All team members are encouraged to suggest changes to improve process safety. Our key activities included the launch of safety month, emergency evacuation trainings, safety trainings and interactions, and safety-related communication, among others.
Shop floor team members across India, Indonesia, and Africa are helping solve problems related to their own jobs through quality circles, a participatory management technique.
His Excellency, Mozambique’s President Filipe Jacinto Nyusi,
inaugurates Beleza—our manufacturing plant in Mozambique
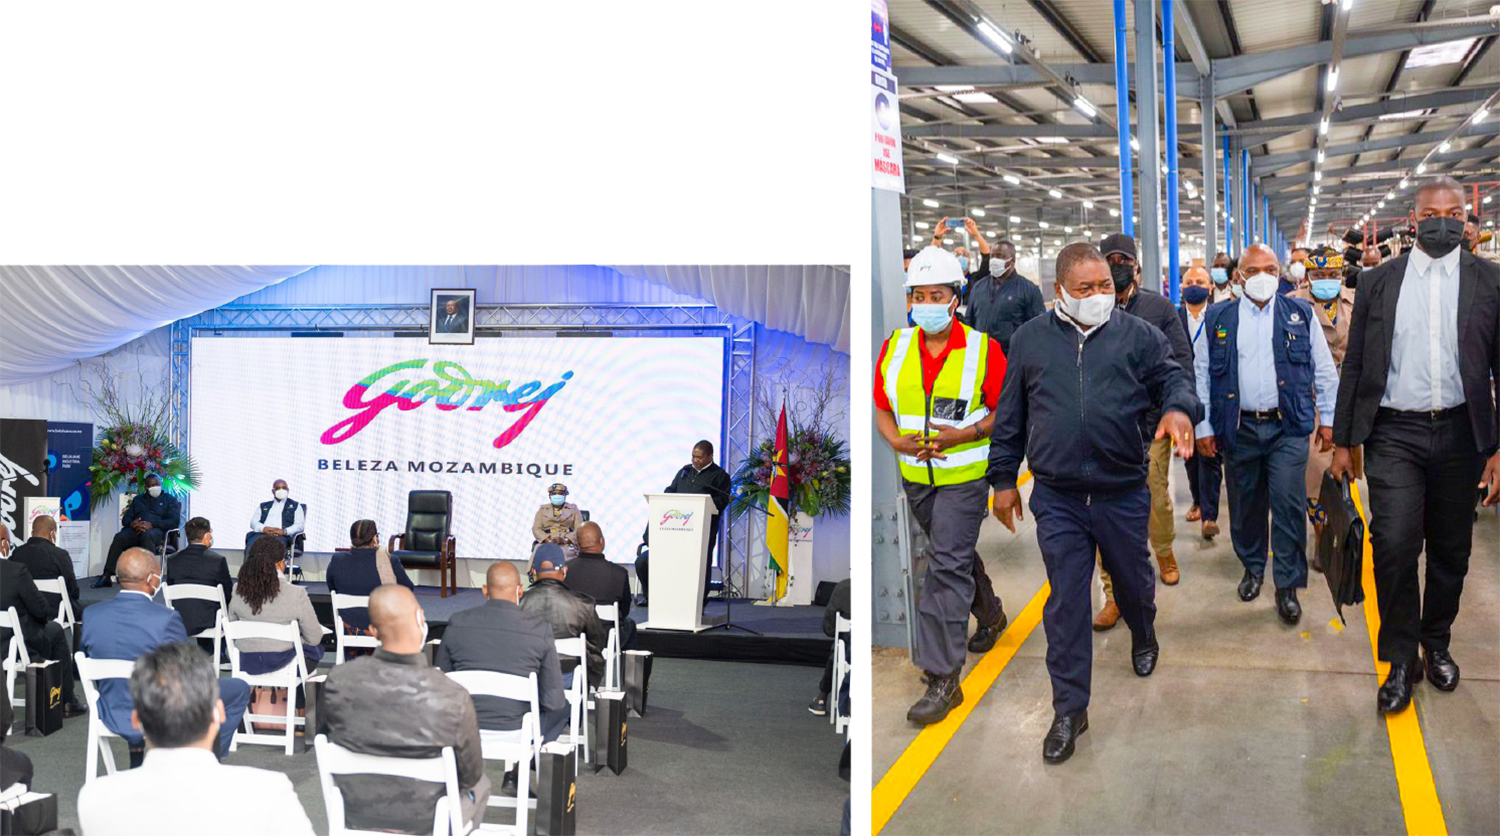
His Excellency, Mozambique’s President Filipe Jacinto Nyusi, inaugurates Beleza—our manufacturing plant in Mozambique
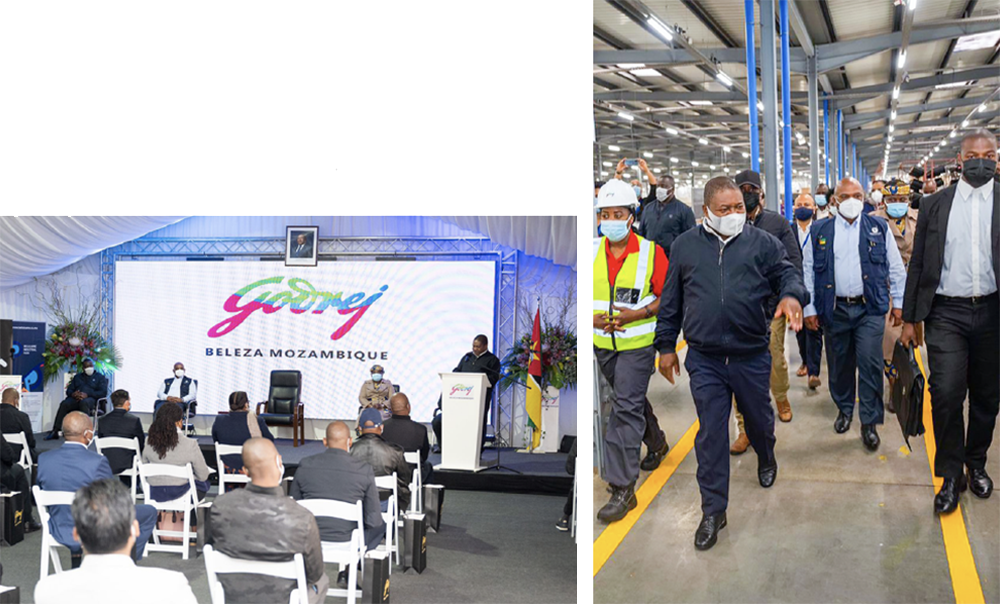
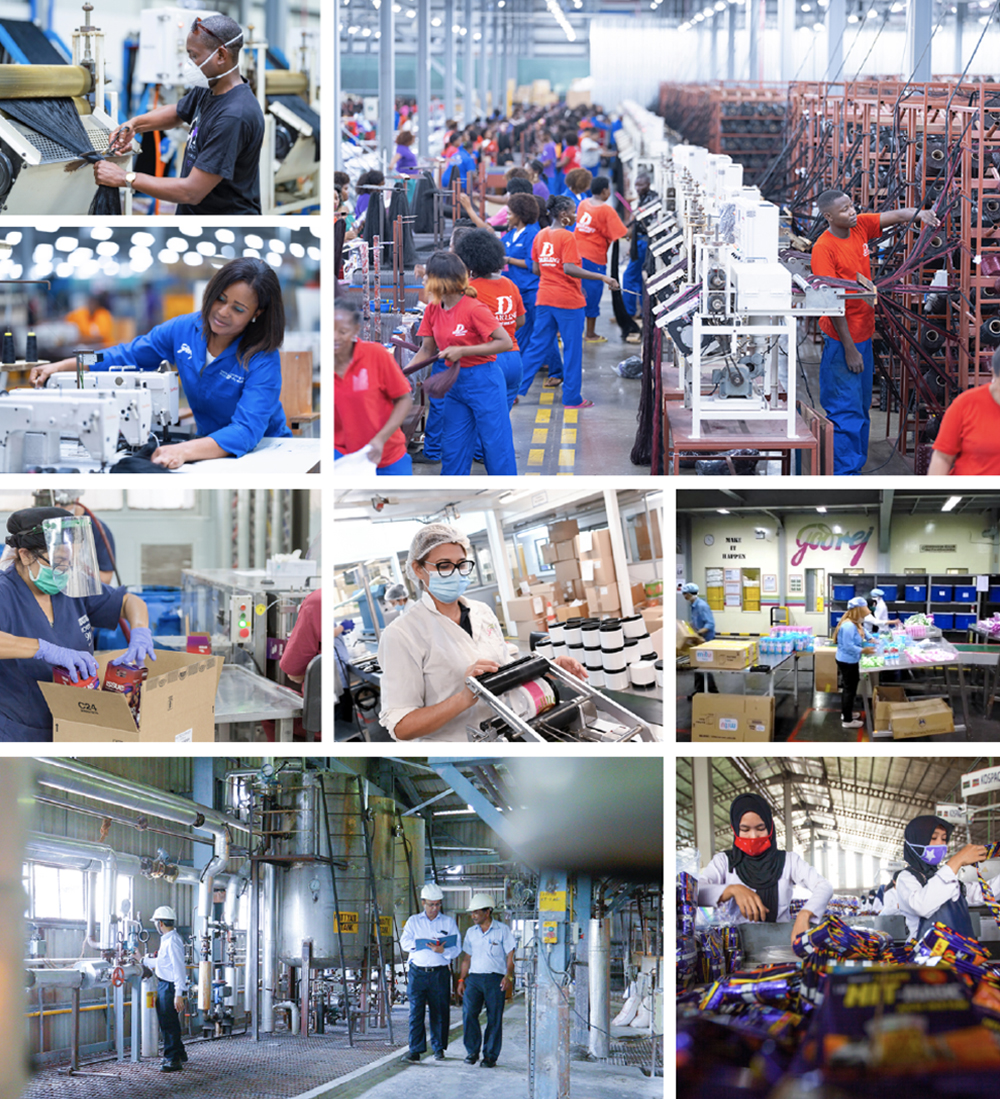
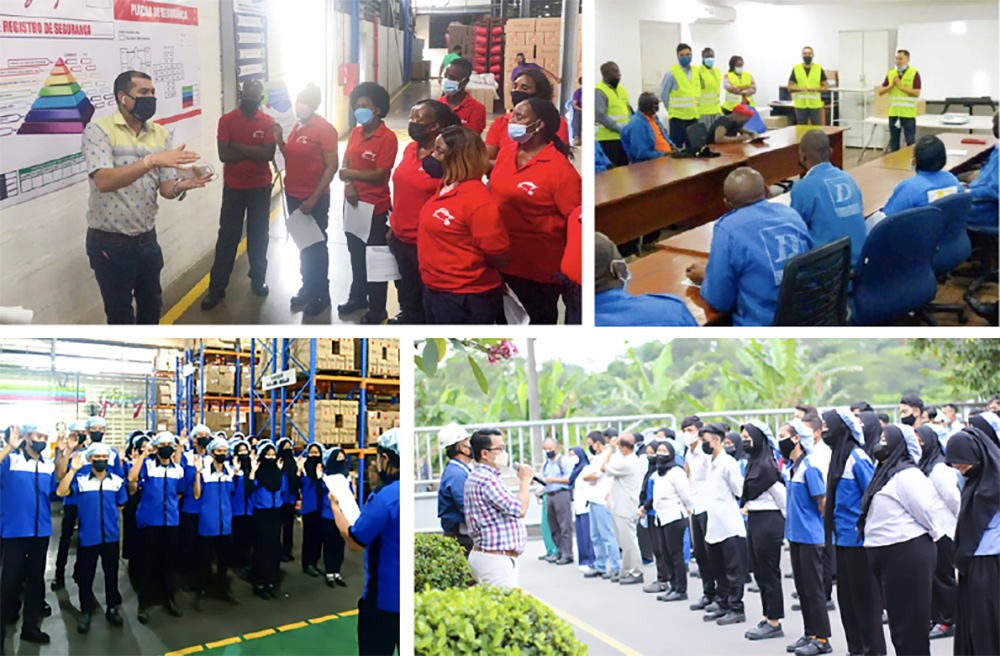
Our factories across our locations in
India, Africa, Latin America and Indonesia
3. Industry 4.0
Making future-ready investments
to further improve productivity
In our North East Cluster, data insights from IoT in our New Conso unit’s LV refill lines and Lokhra unit’s Godrej Expert Rich Crème and Goodknight Jumbo Fast Card lines helped us identify issues in production and arrange for preventive maintenance. IoT at the refill lines at our New Conso unit improved the Overall Equipment Effectiveness (OEE) by 1.4%. We installed an online inspection system in LV refill lines that helps in streamlining the detection of defects and reducing faults during operation. We also trained our operators to focus on improvement of machines and productivity. At our Lokhra 2 units where we manufacture Crème and Ezee, we started monitoring data machine-wise and improved the OEE of the Crème developer machine and autopack machine by 2.64% and 8.42%, respectively. We installed digital twins in the Ezee section, which facilitated changes in layout for improved efficiency in the transfer of material, reduction in manpower, energy savings, and better space utilisation. We also installed an energy management system at our New Conso unit that will help us achieve 5%-6% saving in electrical energy consumption.
Data insights from IoT in our Baddi and Katha soap lines in our North Cluster helped in taking timely decisions to improve efficiency and reduce downtime. In Katha soap line number 1, our OEE improved by 5%. We recently installed IoT in soap line number 3 that helped to improve the OEE by 3%.
In our Central Cluster, we implemented several IoT projects at our Malanpur Soap plant. We installed a Programmable Logic Controller (PLC)-based Supervisory Control and Data Acquisition (SCADA) system in our Soap Noodle plant 1 for monitoring and controlling. This resulted in improvement in noodle productivity by 2 MT/day. We installed a PLC-based temperature control system in 11 RO storage tanks that resulted in the reduction of steam consumption, helping us save ₹ 6.9 lakh/annum. We provided online monitoring of electrical parameters on SCADA of the HT section to take immediate actions. We also automated the flapper system in the Gum Taping machine and overwrapping machines for promotional offer packs. This helped reduce the manpower requirement.
In our South Cluster, we installed IoT in the LV line at the Conso plant in Puducherry that will help in monitoring real-time data and taking timely decisions, thereby improving the OEE by 2%. We implemented a manufacturing portal in all the Coil lines of our KKL plants and Coil-9 plant. It helps track and analyse breakdowns and enables Auto SAP booking. As a result, we are receiving an auto email with production and downtime details for monitoring and improvement. We installed a coil inner wrapping with auto coil feeding and auto leaflet feeding systems in lines 1, 3, and 4 at the Coil-9 unit. We also installed several automation projects such as a vision camera in our Conso plant’s domestic refill line to detect and eject defective products in all sections.
We reduced the manpower requirement by installing an auto flow wrapping line with a leaflet feeder in the KKL plants, installing auto screwing system in MMN plant’s device assembly line, a case erector at the Conso plant, and auto inner carton stacker in Coil-7 plant.
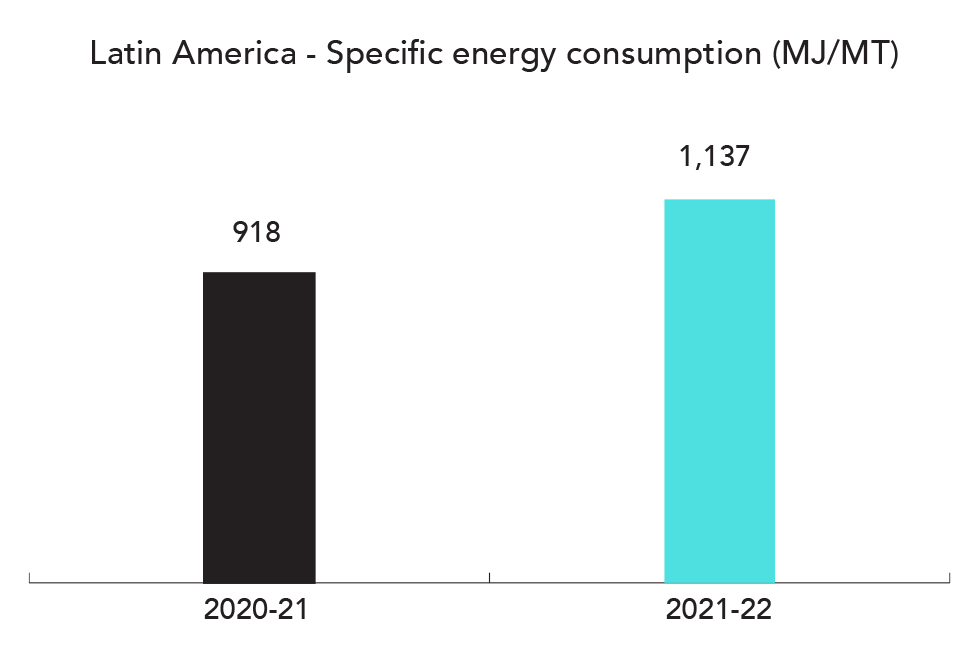
In Argentina, under our ‘Make or Buy’ (MoB) initiative, we operationalised the new flow-packing machine that was installed the previous year. This helped us achieve significant savings and remove our dependency on a third party. We also operationalised a new case packer machine that helps eliminate manual labour and solves the capacity constraint to produce hair colour kits. We made several improvements in our powder mixing area to increase the capacity to attend customer demand, improve people and product safety, and improve productivity. This included mixer automation, installation of a new system to handle raw materials, layout redesign, and recipe redesign.
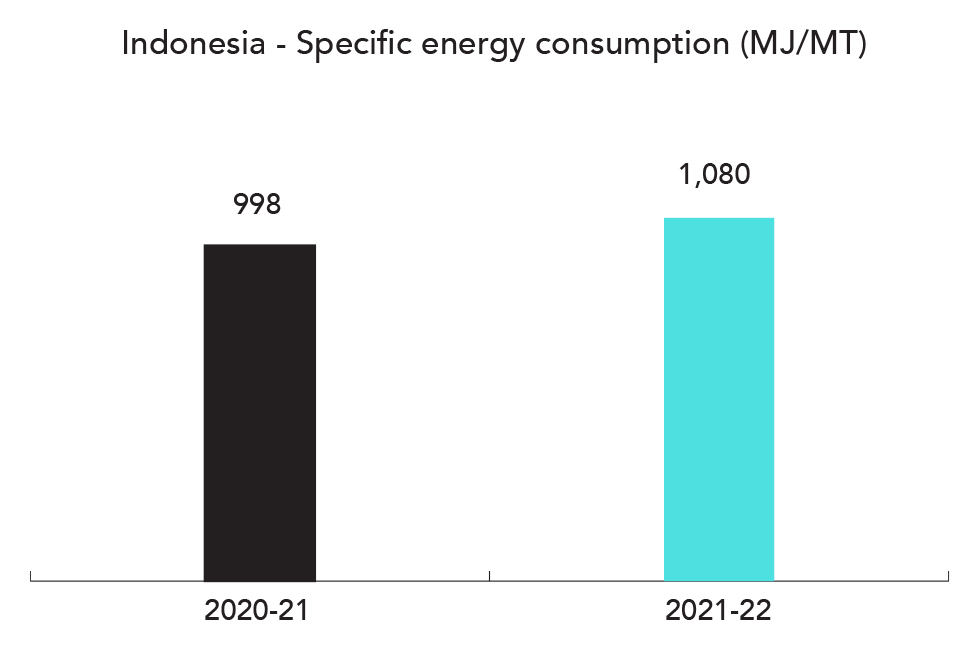
In Indonesia, after the digitisation of shift logbooks, we will be leveraging IoT in the production line. This will allow more accurate analysis, eliminating human intervention. Through this initiative, we are expecting to improve the OEE by 5%-8%.
4. Sustainability of the process
Driving sustainability initiatives across the supply chain and extending them to key vendors through sustainable procurement policies
Manufacturing
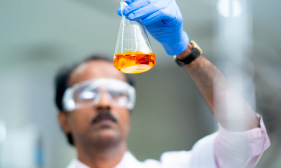
As part of our Good & Green vision, we have identified environmental sustainability goals to be achieved by fiscal year 2025-26. We aim to make one-third of all our products greener than those in 2020. We also aim to be neutral on Scopes 1 and 2 carbon emissions, source at least 35% of our energy mix from renewable sources, improve energy efficiency by 100% in line with our EP100 commitment, and maintain our water positivity and zero waste to landfill status. Most significantly, we intend to announce our commitment towards the global Science-Based Targets initiative (SBTi) and publish our roadmap and targets for emission reduction in line with the globally agreed 1.5-degree reduction scenario.
We track energy, emissions, water, waste, and renewable data for all the locations where we have 100% operational control. We are in the process of validating and imbibing carbon and water pricing to capture the financial implications of our emissions and water use and build sustainability into decision-making at every point in the value chain.
Ensuring judicious use of
natural resources
To measure our progress against our environmental goals, we use the standards, methodologies, and assumptions entailed in the ‘IPCC Guidelines for National Greenhouse Gas Inventories, 2006’ and the ‘IPCC AR5 Assessment Report’. Our performance is guided by the sustainability team at the corporate level and driven by manufacturing cluster heads and team members at each of our manufacturing locations.
Our process includes the following:
- Extensive meetings with multiple stakeholders to align on priorities, budgets, and expected benefits for the year
- Setting targets to help drive environmental sustainability in our manufacturing process and brands
- Cascading an annual operating plan where sustainability targets are made part of the key responsibility areas for ‘green champions’
- An internal sustainability monitoring tool collects and analyses data, and monthly reports highlighting key indicators are generated, including the carbon footprint as per the set (GHG) protocol
- Identifying and circulating best practices on multiple platforms for wider adoption
- A strong governance mechanism to monitor, review, and improve sustainability performance
- Strategic improvement planning for underperforming units
- An innovation cell to look at bleeding-edge sustainability solutions for the medium to long term
- Participating in multiple ESG disclosures to measure our performance against peers engaging external consultants when required for specific initiatives like materiality or climate risk assessments
Our goals and performance for 2025-26
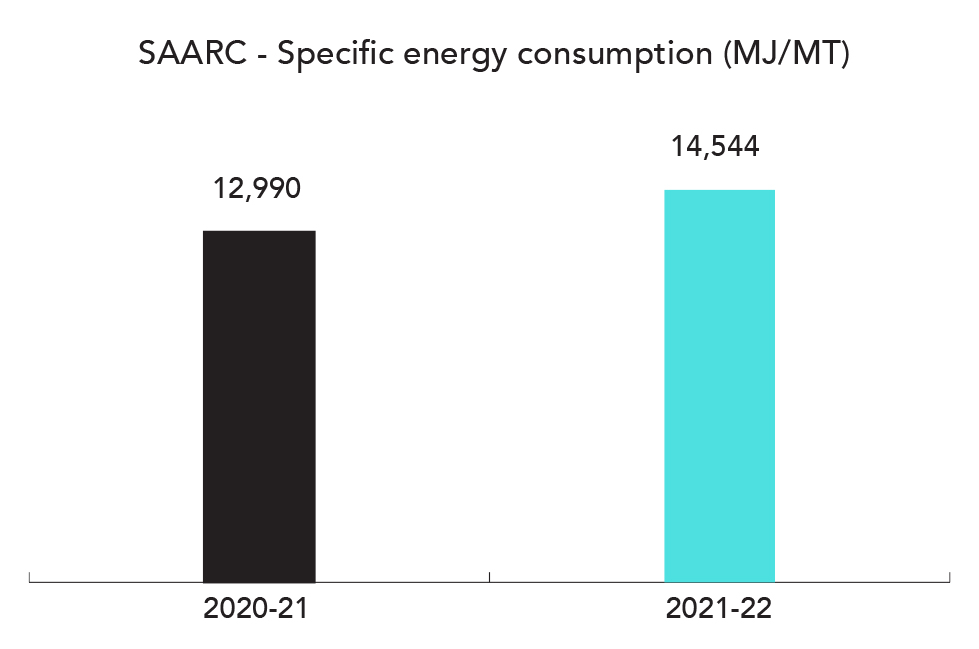
1. Energy
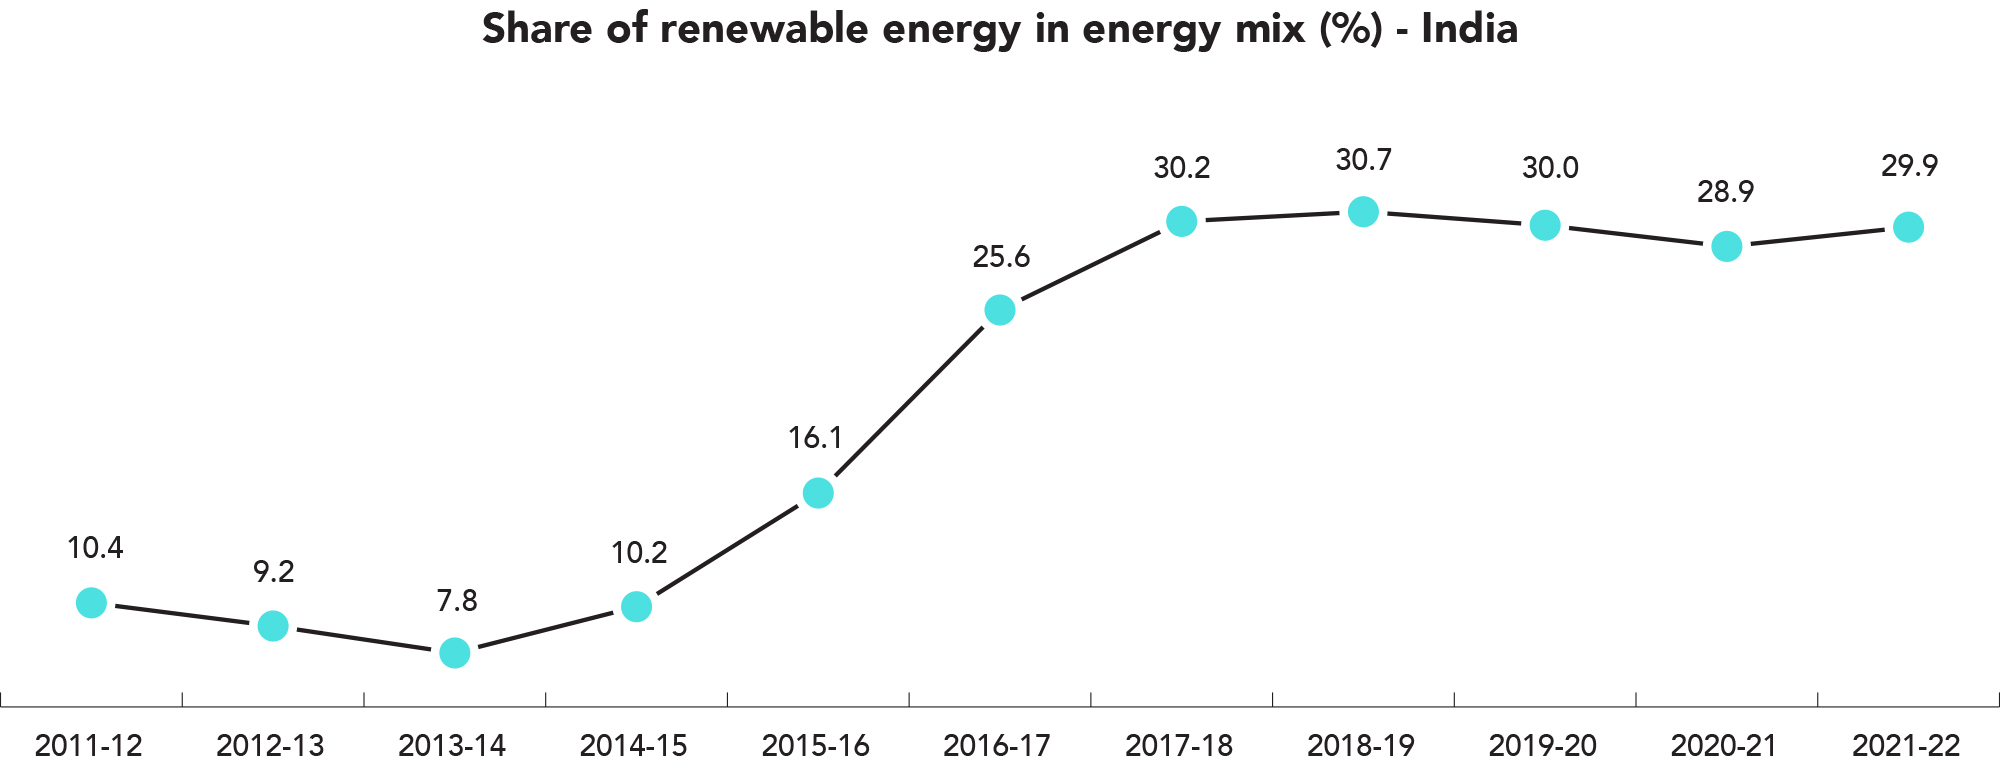
- Reduce specific energy consumption by 40% by 2025 (vs 2011 baseline)
- Increase renewable energy portfolio to 35% by 2025 (vs 2011 baseline)
Approach
- Improvements in processes and increase in the efficiency of systems
- Adoption of green energy sources such as solar and biomass
- Upgradation of technologies
Performance*#
- Reduced our specific energy consumption by 33%
- Increased the renewable energy portfolio to 29.4%
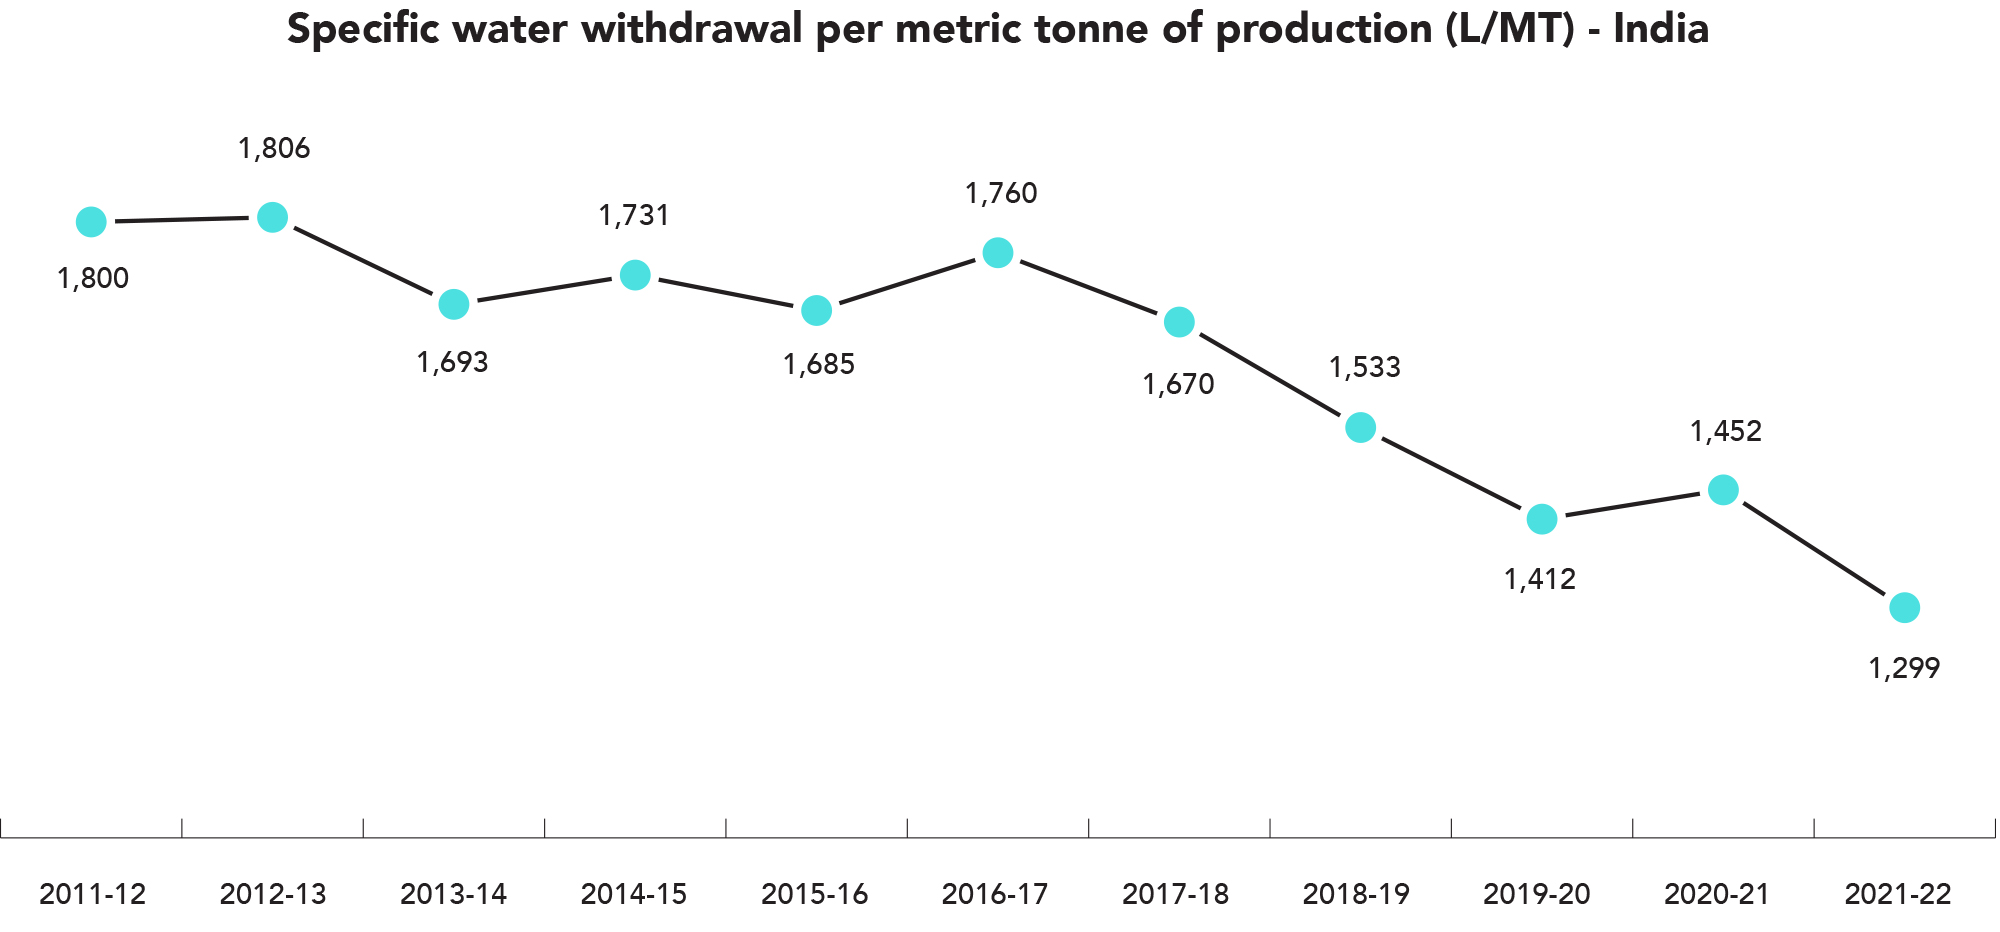
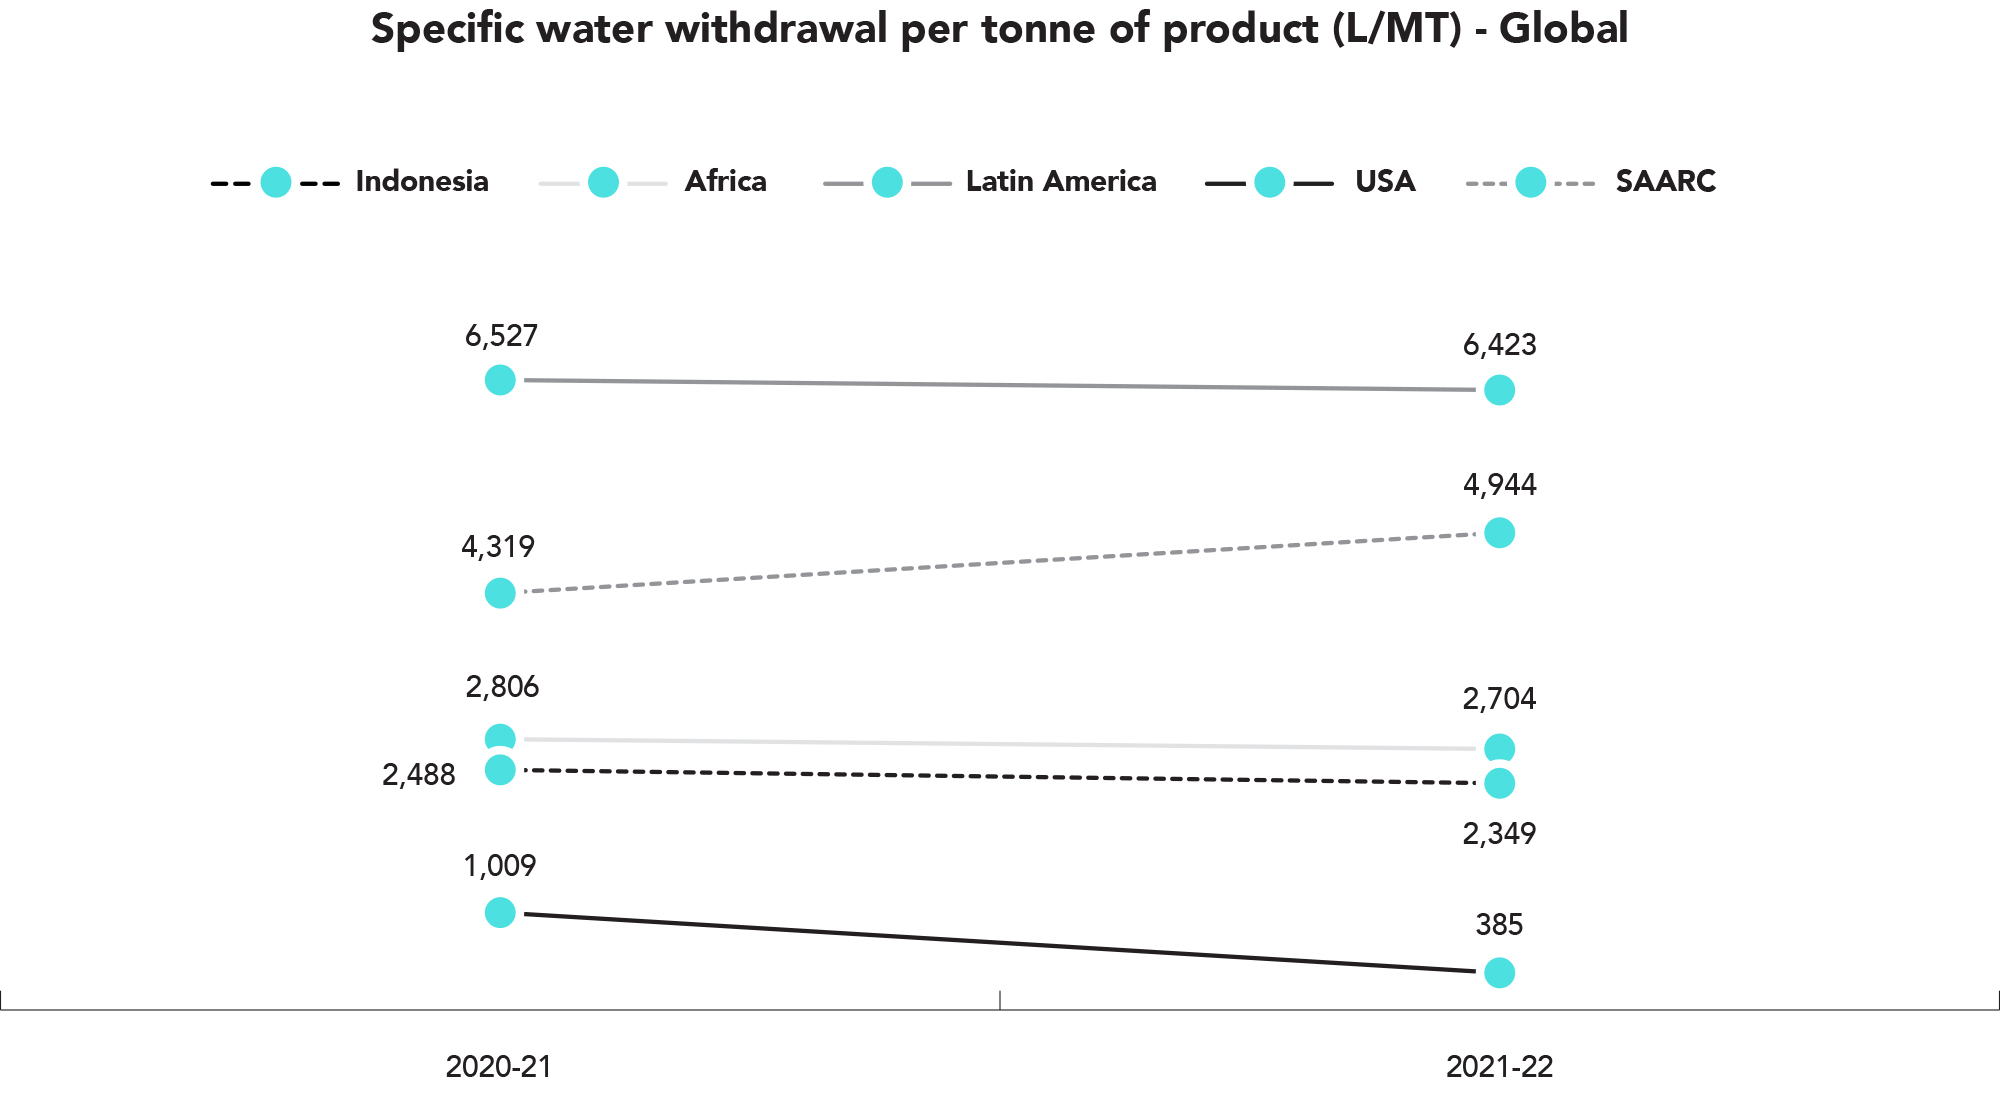
2. Water
Reduced water intensity by 40% by 2025 (vs 2011 baseline) while maintaining water positivity
Approach
- Innovative water management systems, technological improvements, and integrated watershed management programme
Performance**#
- Reduced water intensity by 38% and achieved water positivity (we are conserving three times more water than we use in our operations through rainwater harvesting within our facilities and our community watershed programme).
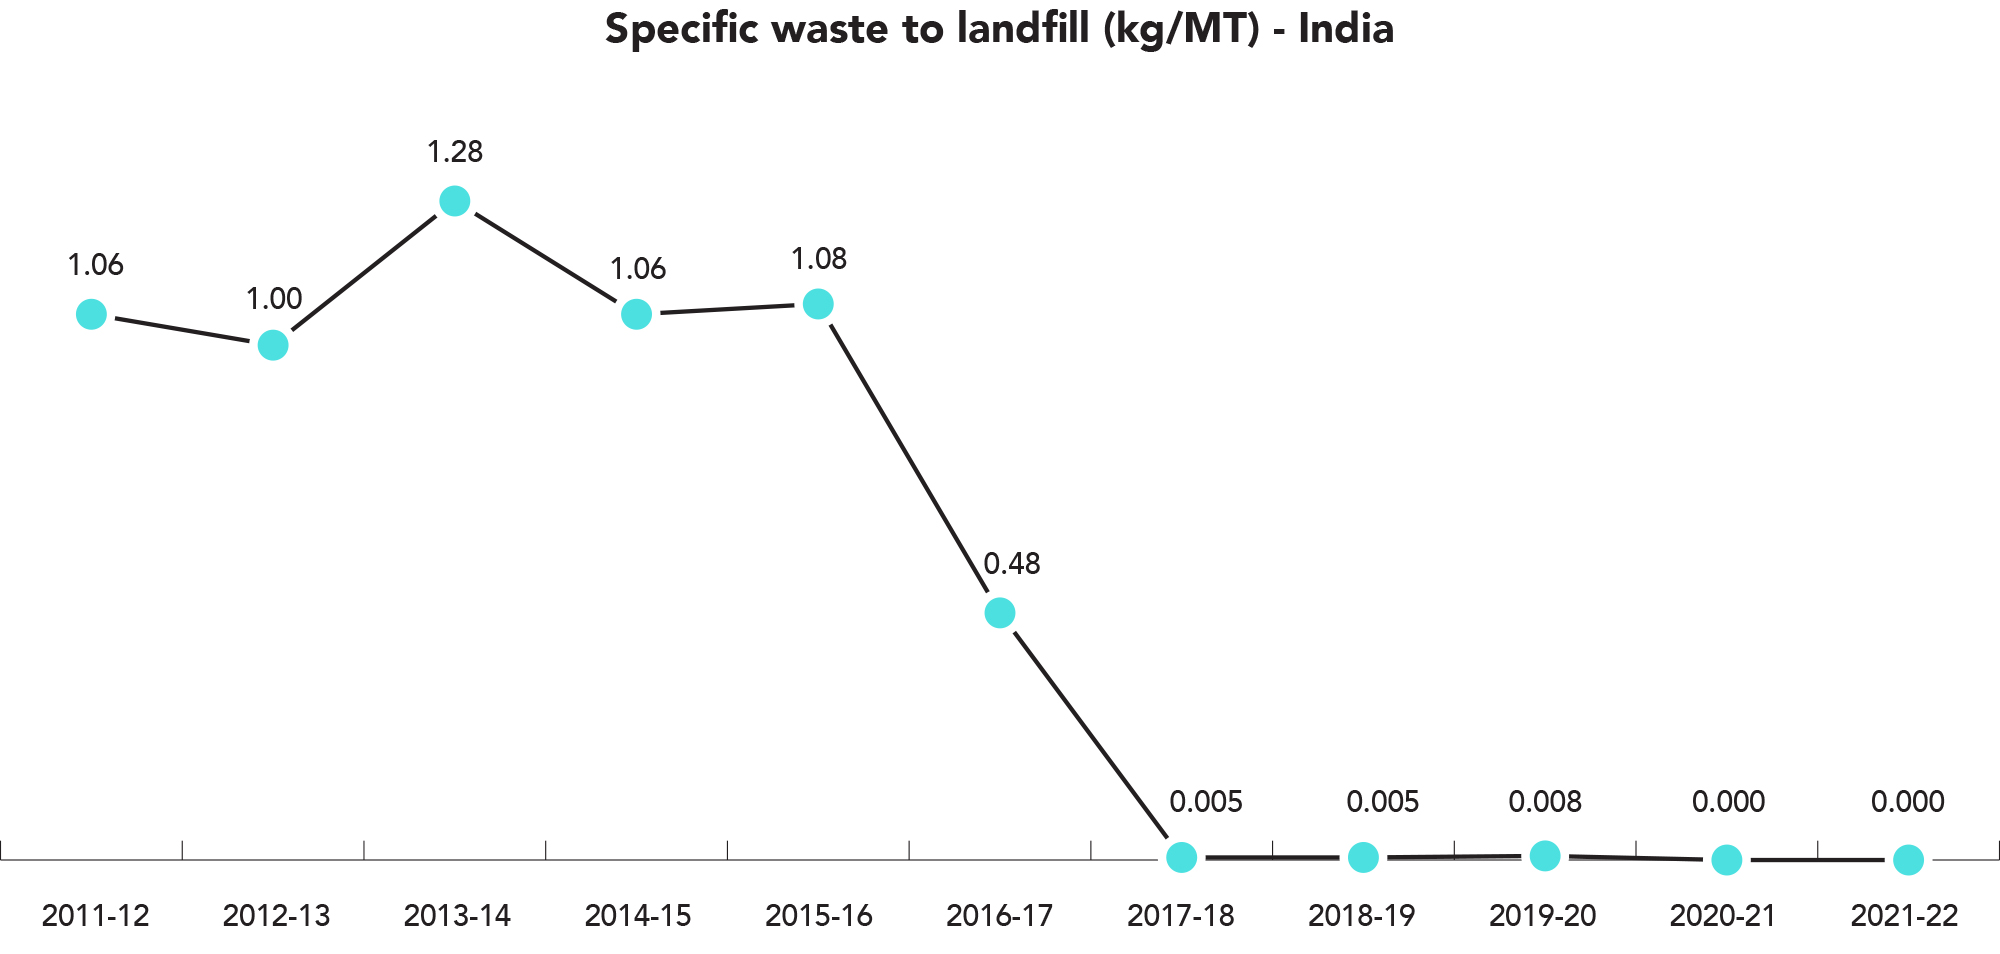
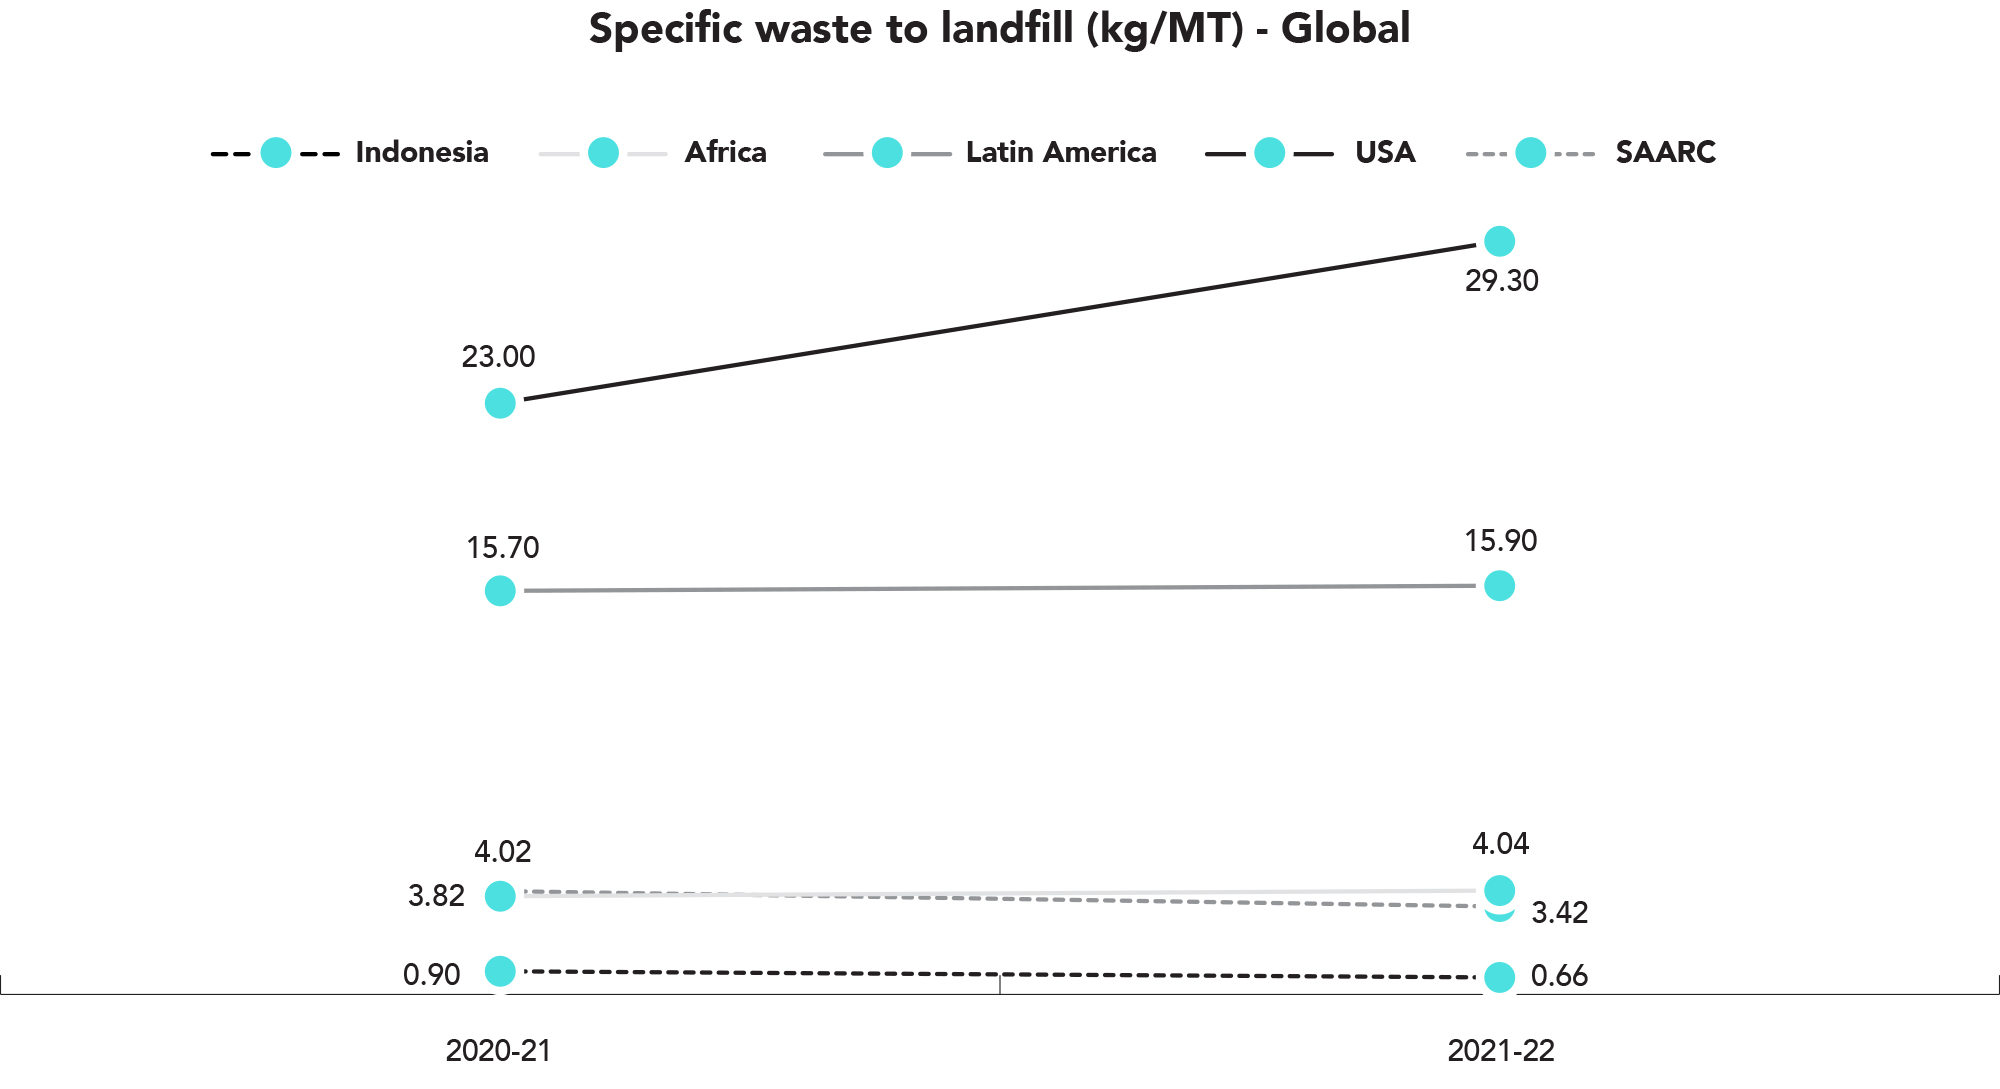
3. Waste
Maintain zero waste to landfill and achieve zero liquid discharge
Approach
- Judicious and innovative use of materials, including reuse and recycling and greater circularity
Performance***#
- Our specific waste to landfill has reduced by 100% (diverted 100% waste from landfill); we have assessed the quantity of liquid discharge and developed a plan to achieve zero liquid discharge
4. Emission
Reduced GHG emission intensity by 45% by 2025 (vs 2011 baseline) and carbon neutrality for Scopes 1 and 2 emissions
Approach
- Adopting cleaner fuels such as biomass and continually improve process efficiencies
Performance****#
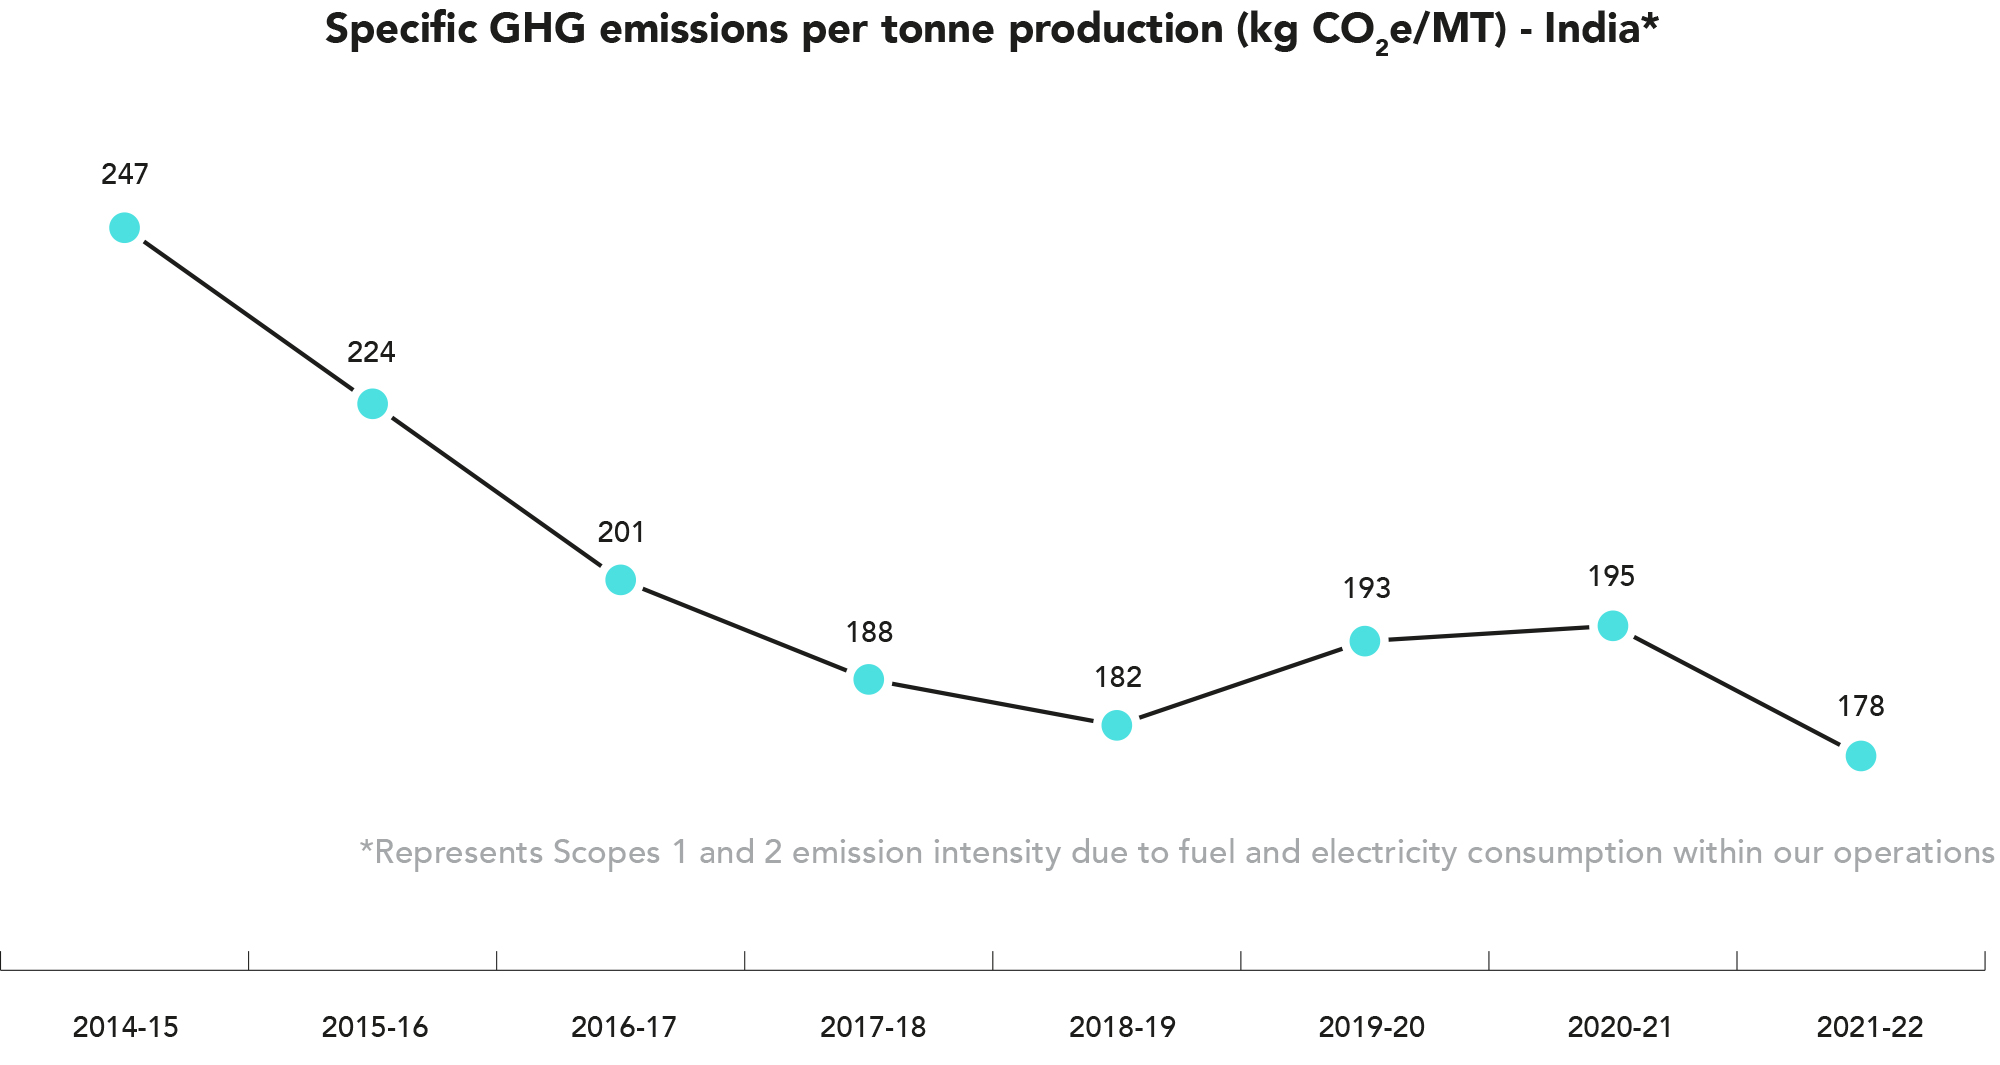
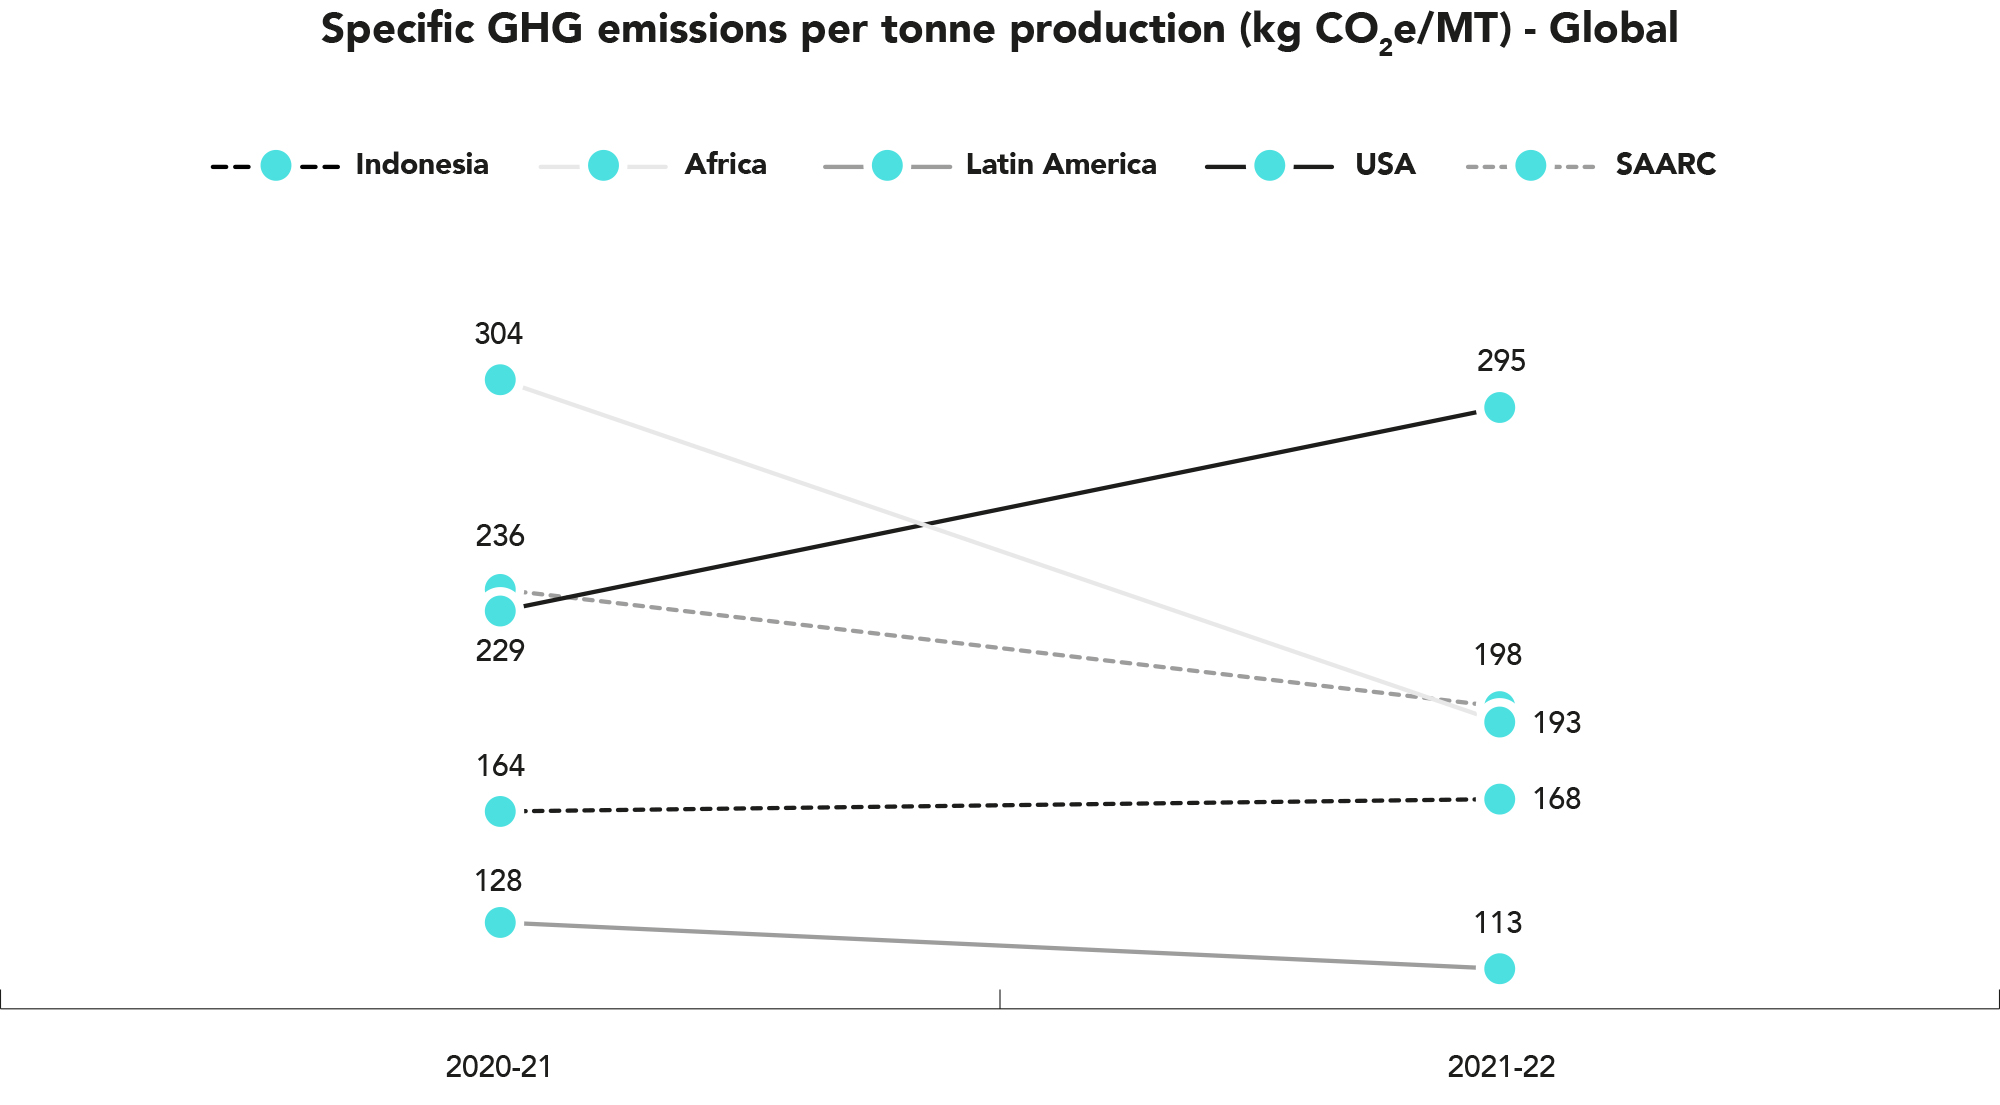
- Reduced our GHG emission intensity by 42%
5. Greener products
Ensure a third of all our products are greener than those in 2020
Approach
- Carry out (LCAs) for products covering 80% of revenue
- mplement findings from LCA to reduce the environmental impact from our products, thus making them ‘greener’
Performance*****
- LCA carried out for products covering 50% of revenue
#Performance as of March 2022 against the fiscal year 2010-11 baseline
*Energy use is calculated by specific energy consumption per tonne of production
**Water usage is calculated by specific water consumption per tonne of production
***Waste generated is calculated by specific waste to landfill per tonne of production
****Emissions are tracked for Scopes 1 and 2 and calculated by specific GHG emissions per tonne of production
*****LCAs for products covered by India revenue
1. Energy
Our energy performance this year is on track with our vision 2025. We have recovered from the delays of last year’s COVID-19 impact. We implemented 80 green initiatives across all our locations.
Highlights from fiscal year 2021-22:
- In Ghana, we installed a BOOT model rooftop solar power plant. The installation does not involve any capex, and the unit rate of power is 15% cheaper. The plant will serve nearly 50% of the energy load of the Spintex plant. The solar plant will help us save nearly USD 1 million over the project life.
- In India’s North East Cluster, we replaced the thermal drying system with a dehumidifier at our Kalapahar Coil plant. This helped reduce specific energy consumption by 45%.
- In India, we have installed solar rooftop PV plants at Katha and Thana in the North Cluster and at Conso in the South Cluster to further add to our renewable energy portfolio.
- In Indonesia, we have replaced diesel fuel with comparatively cleaner natural gas for our oil heaters.
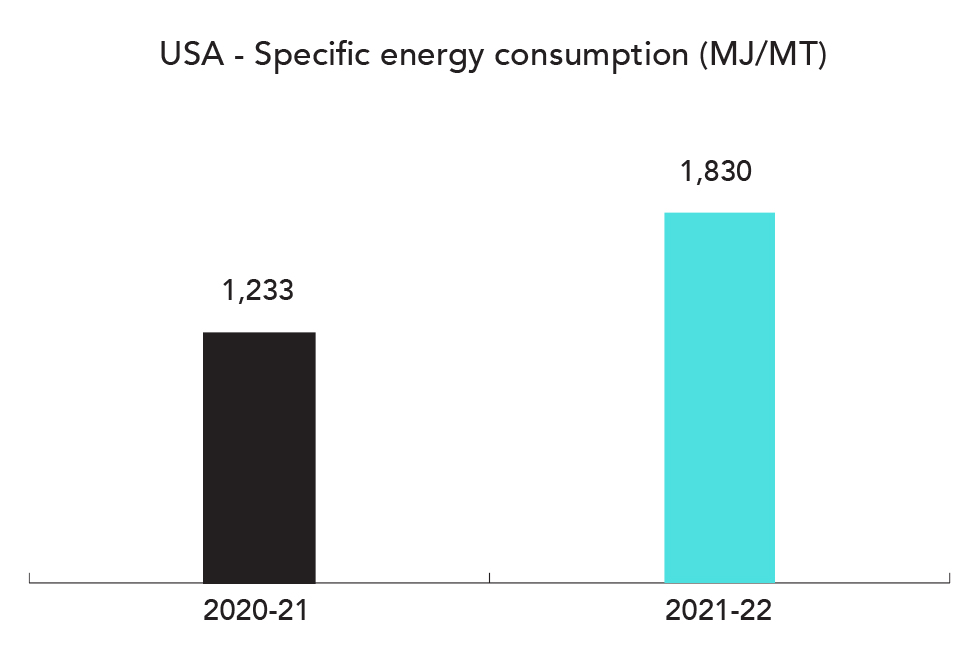
Energy report - Global
2. Water
We evaluate and implement innovative projects to reduce our specific water consumption. Our performance is in line with our set targets.
We continue to source our water from sustainable sources and have also supported integrated watershed projects to replenish groundwater levels.
Highlights from fiscal year 2021-22:
- In Indonesia, we reduced chemical usage in the demineralisation water plant with the help of RO. We have diverted the water rejected from RO to be used for plantation and other domestic usages.
- In Argentina, our team developed a new washing system to reduce water consumption during Mespack machine cleaning. This initiative also helped increase our capacity in the main packing line of our operation.
- In Sri Lanka, our water consumption has increased due to manufacturing of new products such as water-based air freshener and shampoo.
3. Waste
We undertook several initiatives to reduce waste generation and divert waste from landfill. We continue to send ETP sludge from our Malanpur plant to co-processing at a cement plant and have already achieved zero waste to landfill in our India operations.
We are also on track with our (EPR) commitment. We use approximately 19,500 MT of plastic packaging for our products. We are now plastic neutral, which means we take back the equivalent amount of plastic that we send out to our consumers. In addition, we continue to invest in community solid waste management programmes.
Highlights from fiscal year 2021-22:
- In Chile, we continue to segregate and manage our solid waste. We have destroyed 100% of our hazardous waste with minimal effect. In addition, we have lowered the proportion of hazardous waste, with respect to the total waste generated, from 9% fiscal year 2021 to only 1.65% in fiscal year 2022. We continue to increase the proportion of waste sent for recycling. In fiscal year 2021-22, we recycled paper and cardboard, glass, metals, and other materials that constitute 45% of the total waste generated.
proportion of waste sent for recycling. In fiscal year 2021-22, we recycled paper and cardboard, glass, metals, and other materials that constitute 45% of the total waste generated.
- In Mozambique, we have started diverting waste to recycling.
4. Emission
All our manufacturing units have systems in place for monitoring GHG emissions and short-term reduction targets with the long-term aim of achieving Scopes 1 and 2 carbon neutrality. Our initiatives on improving energy mix and reducing specific consumption have helped us reduce our GHG emissions. Some of these initiatives include switching to renewable biomass for boilers, increased procurement of renewable energy, flue gas heat recovery from boilers for process utilisation, and installation of energy-efficient equipment, among others. In addition, we continue to invest in community carbon mitigation programmes.
Highlights from fiscal year 2021-22:
- In Ghana, we installed a BOOT model rooftop solar power plant. The solar plant will help reduce the GHG footprint by approximately 126 tonnes of CO2 equivalent per annum.
5. Greener products
Besides greening our manufacturing process, we aim to make a third of our products greener than they were in 2020. We also aim to carry out LCAs for our major products that cover 80% of our revenue by fiscal year 2025-26. Furthermore, we aim to implement the findings of the assessment to manufacture greener products and implement a sustainable framework for all new product developments.
Highlights from fiscal year 2021-22:
- We completed LCA for 5 products Godrej No.1, Goodknight Gold Flash liquid vapouriser, Godrej Expert Rich Creme, and Godrej Ezee, Goodknight Jumbo Coil which constitute approximately 50% of India revenue.
- For Goodknight Activ liquid vapouriser, we have started trials using (PCR) for the bottle and cap.
Innovating sustainable packaging
As an FMCG business, packaging plays an extremely important role in maintaining product integrity. We use delightful design and packaging to differentiate our products, and we aim to do this in an eco-friendly manner. Several of our products are known for unique packaging, which balances utility and recyclability.
In addition to our Good & Green targets, at a company level, we have identified sustainable packaging targets for fiscal year 2024-25.
Strengthening business outcomes
Moving towards green packaging
The need
India generates over 3.4 million tonnes of plastic waste annually, of which only one-fourth is recycled. As an FMCG company, we use close to 20,000 MT of plastic packaging every year. We collect 100% of post-consumer plastic waste as part of our EPR compliance. We also aim to reuse this PCR plastic back in our packaging and replace the virgin plastic we use.
Our aim for this eco-friendly switch is to be cost-effective, ensure the same or superior quality, and that it continues to provide a delightful experience for our consumers.
The solution
We made Goodknight coil poly bags out of 90% PCR plastic for our South Coil units. This is our first successful attempt on a circular economy project. The recycled granules used to make the poly bags are sourced from a solid waste management site in Hyderabad and are processed at a facility that was co-funded by us. We also use them back in our packaging. We successfully implemented the replacement after several trials and detailed assessment.
We have replaced 50% of all our South Coil unit’s requirement with this initiative, and aim to replace 600 tonnes of virgin plastic on full-scale implementation.
Optimising packaging for
Goodknight Jumbo Coil

Optimising packaging for
Goodknight Jumbo Coil
Our goals and performance
1. Reduce packaging consumption per unit of production by 20% from the base year of the fiscal year 2017-18
Approach
- Process improvements and collaboration with packaging vendors to make packaging more efficient
Performance
- Established a monitoring system to track and implement initiatives to reduce consumption. reduced packaging intensity by 6%
2. Ensured 100% of the packaging material be recyclable, reusable, recoverable, or compostable
Approach
- Upgrade to newer technologies and innovate for alternate packaging materials
Performance
Assessing status of packaging materials
3. Use at least 10% PCR content in plastic packaging (this target will be revised based on the new, more stringent plastic use guidelines)
Approach
- Partner with vendors and enterprises to enable the use of PCR plastic instead of virgin plasticc
Performance
- Using 3.5% PCR content in plastic packaging
Highlights from fiscal year 2021-22:
- We made Goodknight coil poly bags out of 90% PCR plastic for our South Coil units. This project is a first of its kind on circular economy in India. The recycled granules used to make the poly bags are sourced from our solid waste management project in Hyderabad. We collect the post-consumer plastic waste as part of our EPR obligation, get it processed in a facility that was co-funded by us, and use it back in our packaging. We successfully completed the pilot implementation after several trials and detailed assessment. We have replaced 50% of our virgin plastic need for coil poly bag manufacturing in our South Cluster.
- Optimised Godrej Protekt’s refill pouch dimensions for the 1.5 litre pack, resulting in annual savings of ₹ 1.8 crore.
- All material and weight-saving sustainable packaging initiatives resulted in an annual plastic saving of 1,706 MT, paper savings of 169 MT, tin savings of 144 MT, and total cost savings of approximately ₹ 25 crore.
Supply chain
Since 2015, we have defined our sustainability commitment expectations for suppliers, linked to our Good & Green goals. This is detailed in the GCPL Sustainable Procurement Policy. All our key suppliers are expected to align with this, and we are committed to enabling them to get there. Existing and new suppliers are expected to conform to the expectations listed under the policy. We are committed to helping our suppliers make their operations more sustainable through the following ways:
- Assist in reducing specific energy and specific water consumption, waste discharge to landfill, and specific CO2 emissions
- Identify and mitigate ESG concerns
- Help enhance process efficiency, reduce the use of hazardous and toxic materials, and responsibly dispose toxic waste, if any
- Recommend the use of renewable sources of energy, wherever possible
As part of our supplier scoring process, we collate qualitative and quantitative data and develop a composite score based on the responses. To drive continuous adherence, we schedule self-declarations from suppliers, as well as external audits, identify category-wise targets, and share industry best practices and suggested actions.
As a part of supplier assessments in India, we have evaluated 135 suppliers so far (accounting for around 72% of our procurement spends) on being quality centred, ethically driven, green inspired, and socially focused.
Due to the pandemic, we conducted only paper audits and no physical site visits. Of 125 vendors with historical scores, 51 vendors showed a positive improvement, however at an overall level, the average scores remained flat. None of the vendors showed any non-compliance on ethical policies. We flagged 1% of the evaluated suppliers in the sustainability risk zone.
To drive continuous improvement, we have shared industry best practices and suggested actions. Additionally, sustainability assessment through a self-declared questionnaire has become a part of our new vendor initiation protocol.
n Argentina, we are assessing 14 vendors (accounting for nearly 50% of our purchases), including raw materials suppliers, packaging suppliers, and local material vendors. We have made efforts to execute an online audit of our vendors and have been monitoring their issues and risks.
In Chile, we are assessing 8 vendors (accounting for nearly 27% of our purchases). We are auditing our vendors for sustainability of their process and have been monitoring their issues and risks.
In Indonesia, we continue to work with 18 of our vendors (accounting for 65% of our purchases) to monitor sustainability of their process.